Chromatography
Ultrapure Water for HPLC–SEC Analysis
Oct 24 2016
Author: Katrin Töppner & Dr Elmar Herbig on behalf of Sartorius Stedim Biotech
High-performance liquid chromatography (HPLC) is an analytical procedure for the separation, identification and quantification of substances. Unlike other variants of biopolymer HPLC (ion-exchange, hydrophobic interaction and reversed phase chromatography) that in general are performed in a gradient mode, SEC (size exclusion chromatography) is generally an isocratic method [1].
Size Exclusion Chromatography
Size exclusion chromatography (SEC), which includes gel permeation chromatography (GPC) and gel filtration chromatography (a special SEC method performed under aqueous conditions), works with a porous matrix of spherical particles as a stationary phase. Small molecules are able to penetrate into the pores and are therefore retained. By contrast, very large molecules are excluded and pass through the column at linear flow velocity. Hence, molecules are separated based on their size, with the large molecules exiting the column first and the small molecules later [2].
A constant composition of the eluant is used for this SEC method. To minimise enthalpic effects during SEC, a strong eluant with correspondingly high elution strength is employed. In SEC, this is usually a buffer with an adjusted pH and a salt additive. An SEC column suitable for solving the specific problem at hand must be chosen to successfully perform this analytical method. A successful approach then lies in the selection of a suitable solvent, an optimal flow rate, the appropriate injection volume and concentration, as well as in the treatment of the column, both during operation and ‘offline’ handling (regeneration and storage) [1].
SEC is a separation method frequently used for biopolymers. Its current areas of application are the following:
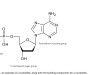
• Determination of molecular weight, e.g., that of antibodies (immunoglobulin G; (see Figure 1), peptides and proteins)
• SEC as a tool for studying conformational changes
• SEC in downstream processing (subsequent processing and purification of a product)
• A special application for SEC restricted-access columns for automated sample preparation of peptide and protein mixtures [1]
Over the past decades, biopharmaceuticals have gained an important position on the medical drug market. Among these biopharmaceuticals are therapeutic enzymes, coagulation factors, numerous hormones – such as insulin, epoetin or growth hormones – monoclonal antibodies (mAbs) and biotech engineered vaccines [3].
SEC analysis is a standard method in downstream processing for determining the purity and aggregation states of the target molecule during biomanufacturing by recombinant production of therapeutic proteins and antibodies.
Determination of differences in molecular weights to detect contaminants and aggregates is based on the use of highly pure eluants that do not interact at all with the stationary phase.
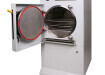
Water of the special quality required for SEC can be purchased from various manufacturers or prepared cost-efficiently on demand directly on site using a lab water purification system, such as the arium® pro VF.
Experimental Evaluation of the Water
This paper describes the qualitative study of a recombinantly produced monoclonal antibody as an example of the use of SEC analysis. The solution employed stems from our in-house manufacture. The impurities and contaminants resulting during upstream processing (preparation of solutions) from the fermentation medium (host cell DNA, host cell proteins, components of the medium, such as albumin, insulin and transferrin), as well as microorganisms and endotoxins, must be reduced during downstream processing. This process is also a source of impurities (addition of proteases, leakage of protein A). The mAb product itself also forms impurities, such as split, aggregated antibodies, deamidated or oxidised forms of the mAb or incorrectly folded molecules [4] that must be detected.
For quality control of the purity of the target protein, SEC analysis, among other methods, is used to detect aggregated antibodies based on their molecular weight separation.
Preliminary trials were conducted to test whether the ultrapure water employed in these runs was suitable for use in SEC analysis. Ultrapure water was produced as described in [5] and used both for these preliminary trials and for further tests to determine the aggregation states of monoclonal antibodies.
The preliminary trials were designed to clarify whether the arium® pro VF utilised (a predecessor model with the same technical specifications for production of ultrapure water as those of the current system shown in Figure 2) can be used for SEC analysis to detect aggregates and monomers of a monoclonal antibody. Furthermore, the effect of various buffer substances was tested.
The following materials were used in the test series (see Table 1):
Table 1. Materials
HPLC Dionex (pump/sampler/column oven/UV detector)
Column Phenomenex Yarra SEC 3000 (OOH-4513-KO 300 x 7.8 mm)
Precolumn Phenomenex SecurityGuard GFC 3000 (4 x 3mm, article no. AJO-4488)
Mobile phase 0.1 M sodium phosphate /0.1 M sodium sulphate, pH 6.6, conductivity 23 mS/cm in arium® pro VF ultrapure water
The column used was a Phenomenex Yarra SEC 3000 (3 µm), which is an SEC column packed with modified silica. Modification of the new-generation ultrapure silica gel ensures minimal protein adsorption, which is essential for excellent recovery and reliable quantitation. The packing in the Yarra column employed has a pore size of 290 Å. This permits a linear range for native proteins between 5 kDa and 700 kDa [6].
Table 2. SEC-HPLC Method
Parameters/Settings
Flow rate [ml/min] 1
Time [min] 20
Maximum pressure [bar] 180
Temperature of column oven [°C] 25
Injection volume [µl] 5
UV detector [nm] 220, 260, 280
Ultrapure water was injected with and without the addition of buffer substances to determine the purity of this water. The buffer substances were added to the ultrapure water as follows:
• TE buffer = 1% 1 M Tris-(hydroxymethyl)-aminomethane (TRIS), 0.2% 0.5 M Tetrasodium ethylenediaminetetraacetate dihydrate (EDTA), 0.01% Sodium dodecyl sulphate (SDS), pH 8, conductivity 1.4 mS/cm
• Citrate = 20 mM citric acid monohydrate, pH 3.6, conductivity 1.7 mS/cm
• Sodium phosphate/sodium sulphate = 0.1 M sodium phosphate/sodium sulphate, pH 6.6, conductivity 23 mS/cm, as well as
• arium® ultrapure water without any buffer additives, for use as a control
Figure 3. HPLC-SEC analysis of various buffers and of arium® pro VF ultrapure water. Mobile phase: 0.1 M sodium phosphate/sodium sulphate, pH 6.6, conductivity 23 mS/cm, in ultrapure water (conditions described in Table 2).
The chromatograms of the SEC run were recorded (Figure 3) and show that the ultrapure water used did not interact at all with the stationary phase. The addition of 0.1 M sodium phosphate/sodium sulphate for the mobile phase likewise showed a straight baseline without peaks. By contrast, the addition of citrate and TE indicated that contaminants or substances are contained that interact with the column matrix, which is expressed by peaks and can distort the actual chromatogram as a result.
After it had been clarified in the trial runs that arium® VF ultrapure water can be used as a solvent for the buffer substances employed to prepare the eluant, actual analysis of the samples was conducted.
To obtain reproducible results in SEC analysis, freshly prepared eluants must always be used. The pH and the ionic strength need to be optimised for the samples available for analysis [1]. Before storing the column, it should be rinsed with eluant first, then flushed with ultrapure water containing 0.05% sodium azide and stored in this condition [1].
The mobile phase (0.1 M sodium phosphate/0.1 M sodium sulphate, pH 6.6, conductivity 23 mS/cm) used for the column was prepared with ultrapure water, which originally had a conductivity of 0.055 µS/cm or 18.2 MΩ (megohms) compensated to 25°C. SEC-HPLC was run using the settings/parameters listed in Table 2. A 0.05% azide solution in ultrapure water was employed for washing and storing the column after use in order to prevent bacterial growth. To prepare both solutions for the HPLC-SEC run, they were each degassed by filtration through a Sartolab BT 500 Bottle Top 0.2 µm vacuum filtration unit. The samples to be injected were prepared by prefiltering them through Sartorius Minisart® RC4 (17821, 0.2µm) and filled in vials (WICOM WIC 42000).
Figure 4. HPLC-SEC analysis of a protein mixture (standard proteins) (conditions are described
in Table 2).
Test Procedure and Results for monoclonal antibody aggregation states Determination
The column and the precolumn are washed with the mobile phase at 1 mL/min until a stable baseline is achieved. A UV detector measures the absorbance of the samples at wavelengths of 220, 260 and 280 nm in milli absorbance units (mAU). The column performance is checked using proteins of a known molecular size (see Figure 4 and Table 3).
Table 3. Standard Proteins Used
Peak Protein Manufacturer Order Number MW [kDa] Ret. [min]
1 Thyroglobulin
(monomer peak) Sigma T 1126 670 6.73
2 Gamma globulin
(monomer peak) Sigma G 5009 150 8.44
3 OV albumin
(monomer peak) Sigma A 5503 45 9.89
4 Ribonuclease Sigma R 5000 14 10.65
5 Adenine Sigma A 8626 0.14 15.35
A standard curve can be generated based on the logarithmic molecular sizes of standard proteins and on the retention times determined. This curve can then be used to calculate unknown samples on the basis of their retention times.
The column efficiency is regularly checked using a standard protein mixture. This performance is affected by the purity of the additives to the eluant, the interaction of the eluant with the column matrix and by the composition of the sample analysed. The buffers used may not interact at all with the stationary phase.
SEC analysis is employed in quality control and is also used in the optimisation and development of purification processes.
The following shows SEC chromatograms recorded during downstream process steps. The monoclonal antibodies are purified in a series of consecutive steps. Cell harvesting, along with clarification and concentration steps, is performed first, followed by a capture step (protein A affinity chromatography). After that, an intermediate step is carried out to remove contaminants (e.g., cation exchangers), and a polishing step is then completed (anion exchangers). Subsequently, virus filtration and final ultrafiltration [see also 7] are performed.
To determine the purity of the antibody, samples are run in SEC columns during downstream processing. The chromatograms of the runs performed after initial clarification of the cell harvest (Figure 5) and protein A affinity chromatography (Figure 6) are shown below.
Figure 5. HPLC-SEC analysis of a monoclonal antibody after cell harvesting and initial clarification during downstream processing (conditions are described in Table 2).
The HPLC analytical run after initial clarification of the cell harvest (Figure 5) shows a number of contaminants, e.g., host cell DNA, host cell proteins, endotoxins, components of the medium and impurities caused by the antibody product itself, as well as aggregates, which need to be removed by the subsequent downstream processing steps.
In the following step, protein A chromatography, the specific affinity of protein A to immunoglobulin G (IgG) is used. A Sartorius Sartobind® protein A (93PRAP06HB-12- -A) adsorber is employed in this step. Following initial clarification (see Figure 5 for analysis), the sample is filtered through the protein A unit. IgG binds to the protein A adsorber, while contaminants pass through the adsorber. The elution of protein A is examined by HPLC-SEC analysis (see Figure 6).
The analysed elution sample of the protein A affinity chromatography run indicates significant purification of the monoclonal antibody. The percentage of aggregates and contaminants is considerably reduced. Fractionation by HPLC-SEC analysis shows two peaks (Figure 6). Based on the respective retention times, these peaks can be calculated as molecular sizes using the standard. The areas of the peaks obtained provide information on the percentages of aggregates and monomers in the mAb solutions (Table 4).
Figure 6. HPLC-SEC analysis of a monoclonal antibody after protein A affinity chromatography during downstream processing (conditions are described in Table 2).
Table 4. Percentages of aggregates of an mAb during purification
mAb aggregates [%] mAb monomers [%]
After harvesting and initial clarification 10 90
After protein A affinity chromatography 3 97
SEC analysis of the percentages of the mAb aggregates and monomers after harvesting and initial clarification (Figure 5) show that 10% aggregates contaminating the mAb still remain (Table 4). The SEC analytical run after the additional purification step using protein A affinity chromatography indicates a decrease in the percentage of aggregates to 3% (Figure 6). No further contaminants are detected by SEC analysis. The results obtained clearly demonstrate that the method used is suitable.
Summary
HPLC-SEC analysis is an important tool for determining the purity of therapeutic proteins and is used worldwide in the manufacturing process of monoclonal antibodies as a standard method to measure the aggregation content and the percentage of contaminants.
As the integrity of proteins – in this case, monoclonal antibodies – is at risk due to temperature changes, the effects of mechanical stress, pH fluctuations and exposure to UV light during production and throughout their entire lifecycle (see also [3]), it is of crucial importance to establish a reliable method for determining the purity of an mAb.
The method described in this paper enabled excellent determination of the aggregation states of monoclonal antibodies. In addition, it demonstrated excellent purification results. An essential prerequisite for performing this method is the purity of the substances and solutions used and, above all, that of water employed as the basic solvent for preparing the solutions. As shown in the preliminary trials (Figure 3), ultrapure water produced by arium® pro VF is suitable as a medium for dissolving buffer substances and salts to prepare the mobile phase used during SEC.
When arium® ultrapure water is used, no ghost peaks [8] caused by an interaction between the mobile and stationary phases and no UV-active contaminants or peak shifts are detectable. Strong organic impurities, expressed in the form of high TOC values, might be manifested in peak shifts because the column matrix becomes more nonpolar as a run progresses. Heavy metal salts, or chelating agents, can shield charges in the column, which could lead to protein folding (increased formation of antibody aggregates). These assumptions must be clarified in further trials.
References
1. Quaglia M., Machtejevas E., Hennessy T., Unger K.K.: Gelfiltration-Größenausschluss-Chromatographie von Biopolymeren-Optimierungsstrategien und Fehlersuche. Excerpted from “HPLC richtig optimiert. Ein Handbuch für Praktiker.” Herausgeber Stavros Kromidas [Publisher]. WILEY-VCH, Weinheim (2006).
2. Schmid Thomas: Vorlesung ETH Zürich. Analytische Chemie (für Biol./Pharm. Wiss.) Teil “Chromatographische und elektrophoretische Trennverfahren,“ p. 58, (2011).
3. Frieß W., Ruberg E.-M.: Proteinarzneistoffe - Sensibel und stressanfällig PHARM. ZTG., 156 JG., 50. AUSG. [50th issue], (2011).
4. Richter A., Jostameling M., Müller K., Hermann A. and Pitschke M.: Quality control of antibodies for human use. Excerpted from: “Antibodies Volume 1, Production and Purification,” edited by G. Subramanian, Kluwer Academic/Plenum Publishers, New York (2004).
5. Nitzki F., Herbig E.: In situ Hybridisierung – Die Bedeutung von Reinstwasser für RNA Technologien. GIT Labor-Fachzeitschrift 57. Jahrgang, 3, (2013) [also available in English: In Situ Hybridization: The Importance of Ultrapure Water for RNA Technologies].
6. Phenomenex Chromatography Product Guide, p. 311 (2015/16).
7. Fish Brendan: Concepts in development of manufacturing strategies for monoclonal antibodies. Excerpted from: “Antibodies Volume 1, Production and Purification,” edited by G. Subramanian, Kluwer Academic/Plenum Publishers, New York (2004).
8. Gottwald, W.: RP-HPLC für Anwender. Reihe: Die Praxis der instrumentellen Analytik, Herausgeber [editor] Gruber, U., Klein, W., VCH Verlagsgesellschaft, Weinheim, pp. 7-8 (1993).
Digital Edition
Lab Asia 31.2 April 2024
April 2024
In This Edition Chromatography Articles - Approaches to troubleshooting an SPE method for the analysis of oligonucleotides (pt i) - High-precision liquid flow processes demand full fluidic c...
View all digital editions


Events
Apr 28 2024 Montreal, Quebec, Canada
May 05 2024 Seville, Spain
InformEx Zone at CPhl North America
May 07 2024 Pennsylvania, PA, USA
May 14 2024 Oklahoma City, OK, USA
May 15 2024 Birmingham, UK