Mass spectrometry & spectroscopy
Published over 3 years ago. See the latest and most current information on Mass spectrometry & spectroscopy.
Recent concerns with the price and availability of helium have led laboratories to look for alternative carrier gases for their gas chromatography mass spectrometry (GC/MS) methods. For GC/MS, hydrogen is the best alternative to helium, and offers potential advantages in terms of chromatographic speed and resolution. However, hydrogen is not an inert gas, and may cause chemical reactions in the mass spectrometer electron ionisation (EI) source. This can lead to disturbed ion ratios in the mass spectrum, spectral infidelity, peak tailing, and nonlinear calibration for some analytes. Therefore, a new EI source for GC/MS and GC/MS/MS was developed and optimised for use with hydrogen carrier gas. The new source, named HydroInert, was used in the system evaluated here to test volatile organic compounds (VOCs) in drinking water. In addition to the new source, the chromatographic conditions were optimised to provide separation of 80 volatile compounds in 7 minutes. Standards and samples were analysed in both scan and SIM data acquisition modes. For the scan data, spectra were deconvoluted with MassHunter Unknowns Analysis software and searched against NIST 20 to assess the spectral fidelity. In both modes, quantitative calibration was performed for the 80 compounds over the range of 0.05 to 25 µg/L. As demonstrated in this note, the system gives excellent results for the analysis of VOCs in drinking water.
One of the analyses commonly used to ensure that the quality of drinking water is the measurement of volatile organic compounds (VOCs). These compounds can appear in drinking water by contamination from numerous sources, including industrial and commercial operations. Another common source is when VOCs are formed by the addition of chlorine (used to disinfect the water) and react with natural organic matter in the source water.
Regulations governing the allowable concentration of VOCs in drinking water vary by country and region but are typically in the low µg/L (ppb) range. Due to the large number of potential contaminants, and the need to measure them at such low levels, GC/MS systems are commonly used. GC/MS offers both the sensitivity and selectivity required to identify and quantify VOCs. Purge and trap [1] and static headspace [2, 3] are two commonly used automated sampling techniques that extract the VOC analytes from water samples and inject them into the GC/MS. This method uses a system configured to perform static headspace/GC/MS analysis of VOCs in drinking water, optimised for using hydrogen as the carrier gas.
Both scan and SIM modes of data acquisition were evaluated. Scan is useful for confirming the identity of found targets, and for identifying nontarget compounds. It can also be used retrospectively to search for compounds that may become of interest in the future. SIM has a substantial advantage in the signal-to-noise ratio and is preferred where quantitation to low levels is required.
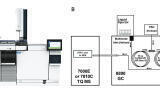
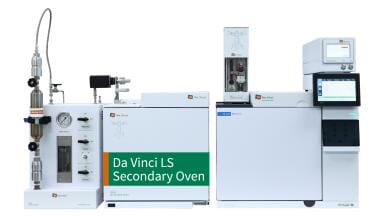
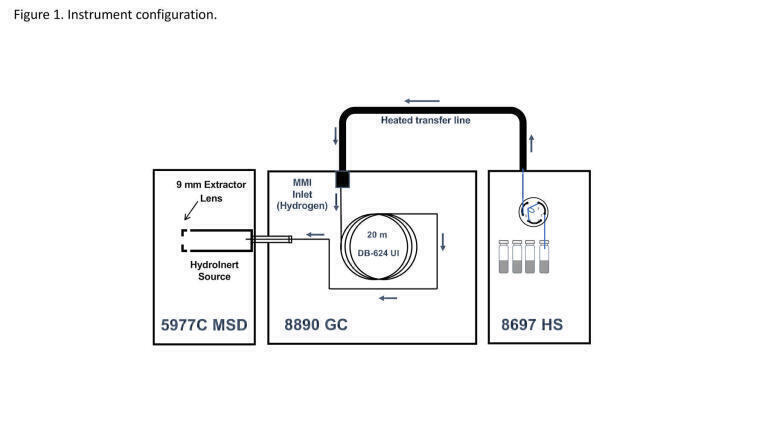
The Agilent 5977C Inert Plus MSD was coupled to the Agilent 8890 GC equipped with a multimode inlet (MMI) and an Agilent 8697 headspace sampler. A HydroInert source (G7078-60930 for the fully assembled source with 9 mm lens) was used in the MSD, and autotuned using the etune tuning algorithm. The analytical method used an Agilent Ultra Inert straight-through 1.0 mm GC inlet liner and a DB 624 UI column, 20 m × 0.18 mm, 1 µm. The Headspace Sampler was connected to the GC carrier gas inlet line between the GC control pneumatics and the GC injection port. A pulsed split injection was used with the split ratio set to 21:1.
Eight calibration levels ranging from 0.05 to 25 µg/L were prepared in water by spiking 5 µL of a corresponding stock solution (which also included the ISTD) into 10.0 mL of water in a 20 mL headspace vial. Five grams of anhydrous sodium sulphate were weighed into each vial before the addition of water and spiking solution. After capping, each vial was vortexed vigorously for 20 seconds, before placement in the headspace sampler. The spiking stock solutions were prepared in methanol using an Agilent 73-compound standard (DWM-525-1), an Agilent six-compound gas standard (DWM-544-1), and an Agilent three-compound ISTD mix (STM-320N-1), containing fluorobenzene (internal standard), 1,2-dichlorobenzene-d4 (surrogate), and BFB (surrogate). The ISTD/surrogate mix was added to each calibration stock solution at a level to give 5 µg/mL of each compound in the water. Agilent MassHunter Workstation software was used for data acquisition and processing.
Figure 1 shows the system configuration used here.
The operating parameters are listed in Table 1.
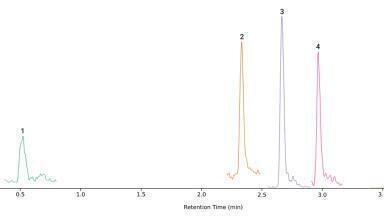
The chromatographic parameters used in the method resulted in good separation of the 80 VOC compounds in less than 7 minutes, as shown in Figure 2. While there are overlapping peaks, their response was measured selectively with the quantifier ions chosen. Most compounds had sufficient response to be measured at or below 0.1 µg/L, and exhibit very good linearity. The average calibration range was 0.16 to 25 µg/L with an average R2 of 0.9978. If necessary, the relative standard error (RSE) value was used to guide removal of the lowest, and in one case highest, calibration points, to achieve an RSE value of <20% (except for acetone). The average Response Factor RSD was <20 for 76 analytes. As expected, polar compounds with higher solubility in water were the worst performers. Acetone is an example, where it also had a contamination issue as observed in the blank, resulting in poor calibration results. A typical example is shown in Figure 3, with the lowest calibrator and calibration curve for iodomethane.
The 25 µg/L VOC standard was analysed with the software, where spectra of the compounds were deconvoluted and searched against the NIST20 library. As seen in Table 2, the library match scores (LMS) are excellent, with an average of 94. There were only six compounds with LMS scores below 90, and these were due to low response and/or interference from overlapping peaks not completely removed by deconvolution. Nitrobenzene (compound 76 in Table 2) gave a very good LMS value of 94. Nitrobenzene reacts readily with hydrogen in a conventional MS source to produce aniline [4], resulting in low LMS values typically in the 60s. The HydroInert source greatly reduces in-source reactions with hydrogen, resulting in the high LMS value for nitrobenzene.
The results of the SIM mode calibration are listed in Table 3. As expected, for most compounds, SIM provided excellent calibration linearity and measurement at or below 0.05 µg/L.
The average calibration range was 0.07 to 24 µg/L, with an average R2 of 0.9990. If necessary, the relative standard error (RSE) value was used to guide removal of the lowest and highest calibration points, to achieve an RSE value of <20% and for choosing between a linear or quadratic fit. For some compounds, a linear fit would meet the <20% RSE criteria, but come close to the limit. However, use of a quadratic fit would significantly improve the RSE. For example, tert-butylbenzene had an RSE of 18.3 with a linear fit, but changing to quadratic lowered the RSE to 8.1. Similar improvements were seen with some of the other substituted benzenes as well. As observed with the scan data calibration, the average response factor RSD was <20 for 76 analytes.
Figure 4 shows a typical example with the lowest calibrator and calibration curve for iodomethane. The improved signal-to-noise ratio provided by SIM, relative to that shown in Figure 3, is clear.
An MDL study was performed after completion of the initial calibration. Eight trials were performed at the lowest level of calibration, 0.05 μg/L. The calculated MDLs were obtained by applying the formula shown in Equation 1. For compounds with higher reporting limits, eight trials were performed at the concentration of 0.1 μg/L. Table 3 lists the calculated MDLs for 80 VOCs. Six compounds had insufficient response, even at the 0.1 μg/L level, so the lowest calibration level used is listed instead in bold and square brackets. As noted in the scan results, acetone also had a contamination issue as observed in the blank, resulting in poor calibration results. The average MDL for the 80 compounds was 0.026 µg/L.
Equation 1: Formula for MDL calculations.
MDL = s · t(n – 1, 1 – alpha = 99) = s · 2.998
Where: t(n – 1, 1 – alpha) = t value for the 99% confidence level with n – 1 degrees of freedom
n = number of trials (8)
s = standard deviation of the eight trials
Samples of municipal tap water from sources in the state of Pennsylvania were analysed using both the scan and SIM methods. Several VOCs were identified by searching their deconvoluted spectra against the NIST20 library. The chromatograms from two of the samples are shown in Figure 5. The concentration of VOCs was determined using quantitative analysis, with both the scan and SIM calibrations. The results are presented in Table 4.
Trichloromethane, bromodichloromethane, dibromochloromethane, and tribromomethane (collectively known as the trihalomethanes) are very common in municipal water treated with chlorine for disinfection purposes.
They are the products of reaction between chlorine and naturally occurring humic and fulvic acids, often present in source water. All trihalomethanes were confirmed in both samples with precisely matching retention times, qualifier ion ratios, and, except for tribromomethane, with good LMS search results. As expected, LMS values decrease with decreasing concentration of the analyte. The cis-1,2-dichloroethylene and tetrachloroethylene are commonly found at trace levels in ground water from areas with a history of industrial activity. Methyl tert-butyl ether (MTBE) was an additive to gasoline several years ago, used in response to federal mandates requiring specified levels of organic oxygen in gasoline. Its use was later banned when it began showing up in ground water as the result of leaking underground storage tanks at gasoline stations
Figure 6 shows the benefits of using both the scan and SIM methods on tap water samples. Spectral matching provides added confidence in the identification of compounds in the water samples.
Figure 6 also shows the extracted SIM quantifier ions and deconvoluted spectra for four of the seven VOCs found in the Eastern PA water sample. Dibromochloromethane [A] is confidently identified with an RT that precisely matches that in the calibration table, an acceptable ratio of the qualifier to quantifier responses (not shown), and a very high library match score. As the concentration of an analyte decreases, the signal-to-noise ratio in the both the spectra and quantifier chromatograms also decrease. In Figure 6, the spectral information is useful down to about 0.1 μg/L. The SIM data, which identifies using precise RT matching and the ratio of the qualifier to quantifier response can be used to lower levels.
While helium remains the preferred carrier gas for GC/MS, hydrogen has been shown here as a viable alternative if problems with the price and/or availability of helium arise. One of the key components contributing to system performance is the new HydroInert source, designed specifically for hydrogen use. In addition to the new source, chromatographic conditions were optimised to provide separation of 80 volatile compounds in 7 minutes. The results of the scan mode evaluation demonstrated excellent spectral matching against the NIST20 library, and excellent calibration linearity with an average range of 0.16 to 25 µg/L.
The results of the SIM mode evaluation demonstrated excellent calibration linearity with an average range of 0.07 to 25 µg/L, and an average MDL for the 80 compounds of 0.026 µg/L.
1. US EPA Method 524.2: Successful Measurement of Purgeable Organic Compounds in Drinking Water by Agilent 8860/5977B GC/MSD. Agilent Technologies application note, publication number 5994-0833EN, 2019.
2. Improved Volatiles Analysis Using Static Headspace, the Agilent 5977B GC/MSD, and a High-Efficiency Source. Agilent Technologies application note, publication number 5991-6539EN, 2016.
3. Fast Volatile Organic Compound Analysis of Drinking Water Using the Agilent 8697 Headspace Sampler in Tandem with Intuvo 9000 GC and 5977B GC/MSD. Agilent Technologies application note, publication number 5994-4449EN, 2021.
4. Agilent Inert Plus HydroInert GC-MS System: Applying H2 Carrier Gas to Real World GC-MS Analyses. Agilent Technologies technical overview, publication number 5994-4889EN, 2022.
Bruce Quimby is a Senior Applications Scientist in the Mass Spectrometry Division of Agilent Technologies, located in Wilmington, Delaware. He received a PhD in analytical chemistry from the University of Massachusetts (Amherst) in 1980 and a bachelor’s degree in chemistry from Mansfield State College (PA) in 1974. He has been at Agilent Technologies since 1979, working the first 10 years in research and development. He has authored or co-authored 18 journal articles and 16 patents in the field of gas chromatography and mass spectrometry. He is currently working in GC/MS applications in multiple areas.
Anastasia Andrianova is a GC/MS Applications Scientist in the Mass Spectrometry Division of Agilent Technologies, located in Wilmington, Delaware. She received a PhD in analytical chemistry from the University of North Dakota (Grand Forks) in 2017 and a masters’ degree in analytical chemistry from the Moscow State University in 2014. Anastasia has been at Agilent Technologies since 2018. She has authored or co-authored over 30 journal articles and application notes, and 1 patent in the field of analytical chemistry, focusing on chromatography and mass spectrometry. Anastasia is currently working in GC/MS applications in multiple areas with a focus on food and environmental analysis.
ILM 51.5 July 2026


.jpg)


-(1).jpg)

.jpg)