Mass spectrometry & spectroscopy
Published over 12 years ago. See the latest and most current information on Mass spectrometry & spectroscopy.
Many scientific instruments require a full and comprehensive calibration before you can use them, while others seem to be ready with little more than a basic background correction. Your trusted laboratory spectrophotometer can fall into both categories. When using it to make an absorbance measurement you will probably just set the wavelength, do a blank on your solvent and then measure your samples.
Each time you do this you’re accepting that several other key parameters are within specification, that there are no significant errors and all is well for you to report your results. On the other hand if you are using your spectrophotometer to measure concentration, with carefully prepared standards to create a multi-point calibration curve, this will eliminate some of the potential errors, by effectively using the spectrophotometer as a comparator. But there are still a number of performance criteria that will have a bearing on the reliability of your results and could limit the range over which it should be used.
There are four key parameters that define the performance of a spectrophotometer; they are…
1. Stray Light
2. Spectral Band Width (SBW)
3. Wavelength Accuracy
4. Absorbance Accuracy
The specific limits for these should be detailed in the specification of your particular model and can usually be found in the Instruction Manual or be requested from the manufacturer.
We will review each of them and then describe how they can be checked
1. Stray Light – by its simplest definition this is a measure of any light that is reaching the detector that is not of the selected wavelength or from the selected source. It’s a good check of the overall optical integrity of your instrument, including the blocking of second order and other un-wanted radiation, as well as indicating the general condition and alignment of optical components and the possible ingress of dust or contamination.
An increase in stray light will introduce non-linearity across the measuring range, but will be more noticeable at higher absorbance values, limiting the effective upper level of absorbance that can be measured (the dynamic range). The graph in Figure 2 shows that an instrument with 1% stray light will start exhibiting errors at just over 1.000A. But whatever the original specification of your spectrophotometer if you are unaware of any deterioration in its stray light levels you may well be reporting incorrect results.
If your higher absorbance readings are always low compared to those from a similarly specified instrument then it is likely that you have high levels of stray light.
To minimise the effect of stray light (and to optimise signal strength - as we’ll see later) it is good practice, where possible, to try to get your results to fall below 1.000A by use of a shorter path length cuvette. For samples with high absorbance levels cuvettes with path lengths of 5, 2 or 1mm are readily available and should enable you to bring readings for most samples to within this limit; while the full range of path lengths from 100 down to 0.01mm should cover every eventuality.
Many cuvettes used for lower sample volumes make use of a reduced width sample chamber; when using this type of cuvette it is imperative to use self-masking types, with black surrounds. Because if the light-beam is broader than the central chamber these block the light that would otherwise pass through the walls of the cuvette without passing through the sample, this would also count as stray light and limit your dynamic range.
2. Spectral Band Width (SBW) – this is often referred to as the ‘resolution’ of a spectrophotometer; but, so as not to confuse this with the display resolution, a less ambiguous term is the ‘optical resolving power’. When we select a wavelength on a spectrophotometer we may imagine that the light emitted, to pass through the sample, is monochromatic (of a single wavelength). But in practice it consists of a range of wavelengths that extend either side of the selected value, at ever decreasing energy levels, in a typical Gaussian curve.
Spectral bandwidth is defined as the width of this band of radiation, emitted by the spectrophotometer, measured at half the peak height, as is shown in Figure 4. The impact of SBW on your results becomes very evident when making measurements at sharp or complex wavelength peaks or where two or more peaks are very close together.
The spectral bandwidth of a spectrophotometer is a fundamental function of its optical design and includes the quality/resolution of the diffraction grating and its beam geometry. On higher value instruments the spectral bandwidth can be adjusted by changing the gap between the exit slits. This slit width is proportional to the spectral band width, and each step change in slit width can be calibrated as a pre-set level of spectral band width, enabling the optical resolving power of the spectrophotometer to be changed.
Every sample also has its own natural bandwidth, covering the band of wavelengths transmitted by the sample. These follow a similar Gaussian distribution as the wavelength of light emitted from the spectrophotometer. To measure a sample accurately the European Pharmacopeia (EP) requires the spectrophotometer to be matched to the sample, having a SBW (of emission) at least ten times less than the natural bandwidth (of transmission) of the sample.
3. Wavelength Accuracy – in traditional monochromator based spectrophotometers, and especially those of older designs, the wavelength accuracy is the most common parameter to deviate over time. In these instruments wavelength settings are made by the mechanical and electro-mechanical drives that move the grating, lamp change mirrors, filters and other components that determine the wavelength selection; and of course with movement comes wear and change.
Some more modern spectrophotometers have built in diagnostic and re-calibration procedures for wavelength accuracy that run automatically at power-up, but even these should be checked regularly for wavelength accuracy as part of a planned validation procedure. A more comprehensive test procedure that includes a check for backlash in the wavelength drive system should also be periodically undertaken.
In Diode Array and CCD Array spectrophotometers movement of the grating and many other optical components is eliminated, making the wavelength selection function more durable and reproducible. But the very nature of these devices produces a more step-like function to wavelength selection, diode by diode or pixel by pixel. Here final wavelength calibration is most likely done through software mapping of pixels or diodes, with a smoothing algorithm that makes the steps less obvious, but there will still be many mechanical settings, and some coarse adjustments for optical alignment that are set in manufacture, but may change with stress and shock over time.
Wavelength accuracy is fundamental to the measurement function of a spectrophotometer but becomes even more critical when measuring at narrow peaks, which have a fast rise and fall, being just a few nanometres off of the peak can result in significant absorbance errors, as clearly illustrated in Figure 5.
4. Absorbance Accuracy – it is, of course, impossible to measure the amount of light absorbed by a sample; a spectrophotometer can only measure the light transmitted through it, so the Beer-Lambert law that defines the relationship between transmittance, absorbance and concentration becomes the foundation for all spectrophotometric applications. With the optical path length and molar absorptivity (extinction coefficient) of the sample constant for most measurements then the absorbance simply follows a logarithmic relationship to the measured transmission. (A = Log10 Io/I where A = Absorbance, I = incident light, Io = light output (and l0/l is the reciprocal of the Transmission).
The logarithmic conversion is easily and reliably carried out by modern instruments, but one major draw-back of digital electronics is that this logarithmic scale can no longer be seen. Look at the analogue meter scale in Figure 6 – at 1 absorbance the detector is receiving just 10% of the signal and beyond 2 absorbance units it is less than 1% of it. Your digital readout gives you no indication of this scale compression, leading you to believe that measuring between zero and one absorbance is much the same as measuring between one and two or even two and three. With the very small signals seen by the detector at these high absorbance values, the noise level of the instrument becomes critical. For poorly performing instruments stability and reproducibility will become much more of an issue. So here again reducing the optical path length, to reduce the absorbance, by selection of suitable path length cuvettes, will return dividends in better performance.
Now these key parameters have been reviewed how can we check they are within specification?
First find out and record the manufacturer’s specification for your spectrophotometer. If it is old or had a tough working life it may be impossible to achieve the performance of a new instrument, but carrying out these tests will help identify if it is still fit for purpose; while repeating these tests on an on-going basis will show any further deterioration and indicate when it eventually needs to be replaced. The tests are more easily carried out on a scanning spectrophotometer, but can also be carried out on a non-scanning instrument by recording a series of results where necessary. So start now, check regularly and log all results.
1. Stray Light is measured by blocking all the wavelengths below a specified level and ensuring that the Absorbance value rises rapidly to its maximum value, or in Transmittance that it falls to a minimum. There are three different filters that are commonly used; one of these can be selected depending on how deep into the UV range you are normally working. All filters, including the purified water reference, should have valid and traceable certification. The three liquid filters most commonly used are:
Sodium Nitrite (NaNO2) with a cut off at 385nm
Sodium Iodide (NaI) with a cut off at 259nm
Potassium Chloride (KCl) with a cut off at 200nm
The test is very simple; just select the filter that matches the wavelength used for the stray light as defined in the specification for your instrument, or the one that is closest to the lowest wavelength you use in practice. Set up a wavelength scan to run from around 50nm above this level to around 20 to 50nm below it if possible. Run a blank on the purified water reference; then scan the filter that you have chosen for the test. The resulting scan should cut off sharply at the specified wavelength, any transmission shown after this wavelength, or failure to reach maximum absorbance at this wavelength, is due to stray light, for which investigation and corrective action should be undertaken (see Figure 7).
While carrying out this test it is also possible to review the base-line flatness of the instrument by doing a full range scan of the reference solution as if it were a sample, after blanking on it. In absorbance the resulting trace should be a flat line at zero, or in transmission a flat line at 100%. Where any peaks or troughs do occur this is most likely due to a lamp change-over or a filter switching in or out, but it may also show up other aberrations or deterioration in the optical system. The wavelengths at which these occur should be noted and if possible be avoided in analytical procedures; where these peaks or troughs are outside the specified ‘baseline flatness’ for the instrument further investigation and corrective action should be undertaken.
2. Spectral Band Width (SBW) is tested using a mixture of Toluene (0.02%) in Hexane against a Hexane blank. A scan between 275 and 260nm reveals a peak around 269nm and a valley around 266nm. The ratio of the absorbance of the peak to the absorbance of the valley indicates the spectral band width of the instrument. A typical table for the conversion of the ratio to a SBW is shown in Figure 8; in practice the table supplied with the standards must always be used.
Calculated Ratio Typical SBW
<1.0 4nm
1.0 to 1.1 3nm
1.3 to 1.4 2nm
1.6 to 1.7 1.5nm
1.9 to 2.0 1nm
2.2 to 2.3 0.5nm
>2.3 0.25nm
NOTE: Always refer to the documentation supplied with the standards to confirm the actual relationships to use.
When using spectrophotometers with a variable slit width reducing this will reduce the SBW and so improve the resolution, however the overall intensity of the light beam will also be reduced leading to a reduction in the signal strength. Selecting the optimum setting for these two conflicting requirements is an important part of method development on this type of instrument.
3. Wavelength Accuracy can be checked in a number of ways, but with each of them it is important to check at several points across the full wavelength range; selecting the most suitable reference material for achieving this is the first objective. The most commonly used filters are:
Holmium Oxide in Perchloric Acid at wavelengths from 241 to 640nm
Holmium Glass Filter at wavelengths from 279 to 638nm
Didymium Glass Filter at wavelengths from 329 to 875nm
Select the filter (or even filters) that cover the wavelength range you are likely to work over. Set the scan range of your spectrophotometer to include all the itemised peaks shown in the certificate for the selected filter, use the blank supplied to set the baseline and then scan the filter. Identify the peaks on the scan manually or by using peak picking software if included, compare the wavelengths of the peaks with those on the Calibration Certificate and ascertain if these are within the manufacturer’s specification for the instrument.
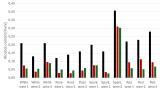
4. Absorbance Accuracy is checked using either neutral density (ND) glass filters or certified solutions of Potassium Dichromate. ND filters cover a relatively broad range of Absorbance values and three or four of these should be used to check specific absorbance values, and ensure the linearity and dynamic range of the spectrophotometer meet the manufacturer’s specification. ND filters give a relatively flat response across the wavelength range from 400 to 800nm but will have absorbance values certified at specific wavelengths.
The Potassium Dichromate liquid filters offer up to five absorbance values at specific wavelength peaks and troughs from 235 to 430nm. Using filters with different concentrations can give a good indication of linearity as well as wavelength accuracy, making these very useful filters for gaining a quick insight into the general condition of a spectrophotometer.
The ND filters can be measured against the supplied blank at the wavelength specified in the calibration certificate, the measured absorbance can then be checked against the values in the certificate and the variance compared to that permitted in the instrument specification. Any deviation should be investigated and corrective action taken.
The Potassium Dichromate liquid filters can also be measured at the discrete wavelengths shown on the calibration certificate, but much more useful information can be gathered by scanning them across the 200 to 550nm wavelength range. The resultant scan, similar to that shown in Figure 10, shows not only the absorbance values but also the wavelength peaks, while the use of up to five concentration levels can also be used to check the absorbance linearity and accuracy of the spectrophotometer in the UV range.
Specials and General Use
The filters described here are typically available as individual items or sets for specific calibration procedures, but customised variations for special applications are available from many manufacturers too. When selecting a supplier it is critical that they are accredited in two very important areas; to ISO9001 for quality management across the whole organisation and to ISO17025 to prove the competence of their calibration laboratory.
All the filters discussed here will need periodic re-certification, many users opt for an annual check in sync with the scheduled maintenance of the instruments they are used on; but depending on their frequency of use, their operating and storage environment and the care with which they are handled this can be extended to 24 months in specific cases. Modern laboratory and process spectrophotometers that use immersion probe technology can also be checked with these filters by connecting an external fibre-optic coupled cuvette holder and fitting the filters into this.
With the performance of your spectrophotometer regularly validated through these procedures, using certified and traceable reference materials, your trust will be vindicated each time you use it. While these quick and easy tests, undertaken regularly, will give you, your colleagues and customers on-going confidence in your results.
Lab Asia 33.4 - August 2026

.jpg)


-(1).jpg)

.jpg)