Laboratory products
Published over 3 years ago. See the latest and most current information on Laboratory products.
Practically all industries rely on viscosity checks to develop, formulate, and produce a product with consistent characteristics. Many important parameters for the production control of materials and also for the development of new products are directly related to the product’s viscosity. Rotational viscometers are perfectly suited for the determination of the viscosity of samples ranging from liquid (e.g., nose drops, juices) to semi-solid (e.g., waxes, sauces). This article provides insights into the basics of viscometry, quality control parameters, and application examples.
The physical quantity ‘viscosity’ gives information on how thick a fluid is and how easily it flows. In scientific terms, viscosity is the measure of a fluid’s internal flow resistance. If you compare a high-viscosity fluid such as honey to a low-viscosity fluid such as eye drops, you will find that at the same temperature, the honey flows slower than the eye drops.
The two-plates model provides a mathematical description for viscosity (Figure 1). Think of a kind of sandwich [1]: There are two plates with fluid placed in-between. The lower plate does not move. The upper plate drifts aside very slowly and subjects the fluid to a stress, which is parallel to its surface: the shear stress (tau). The force applied to the upper plate divided by this plate’s area defines the shear stress. Force/area results in the unit N/m2. The shear rate (gamma-dot) is the velocity of the upper plate divided by the distance between the two plates. Its unit is reciprocal second [s-1]. According to Newton’s Law [2], shear stress is viscosity times shear rate. Therefore, the viscosity (eta) is shear stress divided by shear rate:
ƞ= τ/γ ̇
Figure 1. The virtual viscous sandwich: the two-plates model.
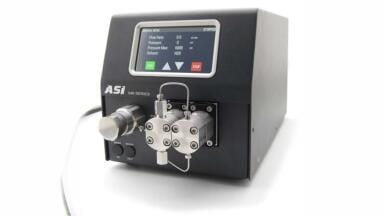
Most rotational viscometers work according to the Searle principle: A motor drives a spindle inside a fixed cup (Figure 2). The test sequence is the following: The user attaches a spindle to the rotational viscometer and sets a speed. The spindle starts to rotate and the sample contained in the cup will follow this movement. While the driving speed is preset, the torque (better: the force) required for turning the spindle against the fluid’s viscous forces is measured. The operator receives the dynamic viscosity and the torque (mostly in %).
For most commonly used spring-type viscometers, the rotation of the spindle causes a deflection of a spring. Several instrument models with different spring types are available in order to measure low-viscosity to high-viscosity substances. In case of low-viscosity substances, the spring needs to be sufficiently sensitive, whereas for samples in the high-viscosity range, a more robust spring is required.
Figure 2. Rotational viscometer – Searle principle. Motor and measuring unit (1), stand (2),
user interface (3), measuring spindle (rotor) (4), sample-filled cup (5).
Viscosity values are not constant values as they are affected by many conditions (Figure 4):
• The ambient conditions: temperature and pressure.
• The substance’s inner structure: A highly viscous substance features tightly linked molecules and resists deformation.
• The shear rate or the shear stress as external force: This includes all kinds of actions like wiping a substance, or gravity. The influence further depends on the strength and on the duration of the external force.
A viscosity curve is used to determine the flow behaviour of a substance. The viscosity is plotted against the shear rate (Figure 3). Such a curve can be generated with a rotational viscometer by increasing the shear rate step-wise with a defined measurement point duration. The temperature and other ambient conditions are constant.
If a fluid’s internal flow resistance is independent of the external force (shear rate) acting upon the fluid, it is ideally viscous (Figure 3: curve 1). Such fluids are named Newtonian liquids after Sir Isaac Newton. Typical materials from this group include water, mineral oil, salad oil, and solvents. Shear-thinning behaviour (or: pseudoplastic) is characterised by decreasing viscosity with increasing shear rates (Figure 3: curve 2). Typical materials are coatings, glues, shampoos, and polymer solutions. Shear-thickening (or: dilatant) means increasing viscosity with increasing shear rates (Figure 3: curve 3). Materials that typically display such behaviour include highly filled dispersions, such as ceramic suspensions, starch dispersions, and dental filling mass.
Figure 3. Viscosity curve. Different types of flow behaviour: Newtonian (1), shear-thinning (2),
shear-thickening (3).
The yield point (also called yield stress) is the lowest shear-stress value above which a material will behave like a fluid and below which the material will act like a solid [3]. The yield point is the minimum force that must be applied to those samples so that they start to flow. The yield point is of vital importance for many practical issues and applications e.g., for quality control of final products or for optimising the production process.
The yield point is not a material constant but depends on the measuring and analysis method used. There are many different methods available. On rotational viscometers, the yield point is often calculated from flow curves measured with a linear increase of the shear rate. The yield point is calculated using model functions (e.g., Bingham, Casson, or Herschel-Bulkley). For all these approximation models, the yield point value τ0 is determined by extrapolation of the flow curve towards a low shear rate value (Figure 4). Each different model function produces a different yield point because the calculation is different.
Figure 4. Flow curve. Sample without yield point (1), sample with yield point (2).
Another method for yield point determination is the vane technique. It is a very quick and easy method for analysing the yield point of paste-like samples. A vane spindle with four thin blades arranged at equal angles is used for the test. A constant low speed is preset on the rotational viscometer. The maximum yield stress, which can be detected during the measurement, is the yield point value. To illustrate the yield point in a graph, the torque is plotted against the time (Figure 5). The diagram has three typical regions [4]:
• The shear stress increases due to deformation as an elastic response.
• A shear stress peak is achieved due to a collapse of the microstructure of the material. This point is called the yield point.
• A stress decay due to the structural breakdown can be visualised.
Figure 5. Yield point determination with the vane technique (red line = yield point).
Concentric cylinder systems: The viscosity of cough syrup was analysed using a spring-type viscometer (R-model for regular viscosity samples) with a concentric cylinder measuring system (Figure 6).
Concentric cylinder systems are absolute measuring systems. Due to the defined spindle geometry, it is possible to calculate shear rate values. The sample volume needed for the measurement is relatively low (approx. 2 mL to 20 mL). In contrast, for a typical rotational viscosity test with standard spindles, a sample volume of 500 mL is required.
In contrast to, for example, water and juices, cough syrup has a relatively high viscosity in order to coat the surface of the throat (Figure 7). To evaluate the flow behaviour of the sample, it is useful to calculate the shear-thinning index. If the value is >1, the sample is shear-thinning. If the value is <1, the sample is shear-thickening. The measured cough syrup has a shear-thinning index of 1, which means that the sample shows a so-called Newtonian behaviour. This means that the sample’s viscosity does not change, even if a higher speed is applied, for instance, during swallowing.
Figure 7. Viscosity measurement of cough syrup.
Cone-plate measuring systems: The quality of a gel for muscle and joint pain was controlled by rotational viscosity testing using a spring-type viscometer (R-model for regular/medium viscosity samples) with a cone-plate measuring system (Figure 8).
The cone-plate system offers the chance to reduce the required sample volume for a viscosity measurement down to 0.5 mL to 2 mL. Moreover, cone-plate measuring systems provide absolute viscosity determinations for sophisticated and reliable measurements.
The Herschel-Bulkley model gives the product’s yield stress as well as the product’s flow index and consistency index (Figure 9). 93.38 N/m² need to be applied on the tube to make the gel flow. In order to prevent liquids like gels from flowing out of the tube when no force is applied, the yield point has to be analysed. A flow index of 0.4155 (<1) means that the gel has a shear-thinning flow behaviour. Gels have to show shear-thinning flow behaviour because the viscosity has to decrease when a force is applied, for example, when squeezing it out of a tube or applying it to the skin.
Figure 9. Flow curve diagram and yield point determination of gel using the Herschel-Bulkley mathematical regression model.
Vane spindles: The yield point of porridge was analysed using a spring-type viscometer (R-model for regular viscosity samples) with a vane spindle (Figure 10).
Vane spindles are required for measuring the yield point of paste-like samples (also with particles). These spindles reduce slippage and minimise structural changes of the sample during immersion of the spindle. The spindles are also suitable for viscosity measurements at a certain speed. Vanes are relative measuring systems but are the only solution for measuring paste-like samples with particles. They are also cheap.
The measured porridge shows a yield stress of 252 N/m2 (Figure 11). This parameter can be important for production, as it defines how much pump power is needed. Furthermore, it is known that the mouthfeel of food products is related to the yield stress. Creaminess correlates with a higher yield stress value.
Figure 11. Yield stress measurement of porridge with vane spindle
T-bar spindles with motorised stand adapter: The viscosity of mayonnaise was measured using a spring-type viscometer (R-model for regular viscosity samples) with a motorised stand adapter and T-bar spindle (Figure 12).
A motorised stand adapter with T-bar spindles is a cheap and reliable measurement configuration for pasty, non-flowing samples like mayonnaise (without particles). The motorised stand adapter replaces the hand-wheel of the viscometer.
Figure 13. Viscosity measurement of mayonnaise with a rotational viscometer equipped with a motorised stand adapter and T-bar spindle. The viscosity values of the last 30 s of the measurement have been averaged.
It moves the spindle during the measurement up- and downwards within the sample at a slow speed. It eliminates the so-called ‘channelling’ problem. Any spindle that rotates constantly at the same height will create an air channel within the sample, which will lead to meaningless viscosity values as the sample is not in contact with the spindle anymore. The moving viscometer head with T-bar spindles eliminates this problem by continuously measuring the intact sample due to the helical spindle movement.
At the beginning of the measurement, the viscosity of the mayonnaise is zero because the measurement started approximately half a centimetre above the sample (Figure 13). Then the spindle rotates through the sample, which leads to a viscosity plateau after a short period of time. Within this plateau, the viscosity can be averaged. The selected mayonnaise has an average viscosity of 14,830 mPa·s (74.2 % torque). The goal of production is that mayonnaise has a proper thickness for the application regardless of the fat content.
1. Mezger, T. 2011. The Rheology Handbook. 3rd revised edition. Hanover: Vincentz Network.
2. Newton, I. 1687. Philosophiae naturalis principia mathematica (“Principia”). London.
3. ISO 3219:1994-10. 1994. Plastics – Polymers/Resins in the Liquid State or as Emulsions or Dispersions – Determination of Viscosity Using a Rotational Viscometer with Defined Shear Rate.
4. Genovese, D. B., and M. A. Rao. 2005. “Components of Vane Yield Stress of Structured Food Dispersions.” Journal of Food Science, 70(8): E498–E504.
ILM 51.5 July 2026


.jpg)
.jpg)


-(1).jpg)
.jpg)

.jpg)

.jpg)


.jpg)
.jpg)

-(1).jpg)