Laboratory products
Published over 2 years ago. See the latest and most current information on Laboratory products.
Quantitative analysis in mass spectrometry is the ability to measure the mass-to-charge (m/z) ratio of ions, with high sensitivity and specificity. By accurately measuring the abundance of target molecules, the precise analysis of complex samples (i.e., proteins, metabolites, drugs, impurities, etc.) is enabled. Accurate quantitation is a critical task in a variety of scientific disciplines.
xC/UV/MS quantitation is an essential workflow in which external calibration curves are used to establish a correlation between signal intensity and analyte concentration. Most instrument providers offer software applications supporting their unique systems and data formats. However, in present-day multi-vendor laboratories, significant constraints exist. Scientists must navigate:
MS Workbook Suite offers:
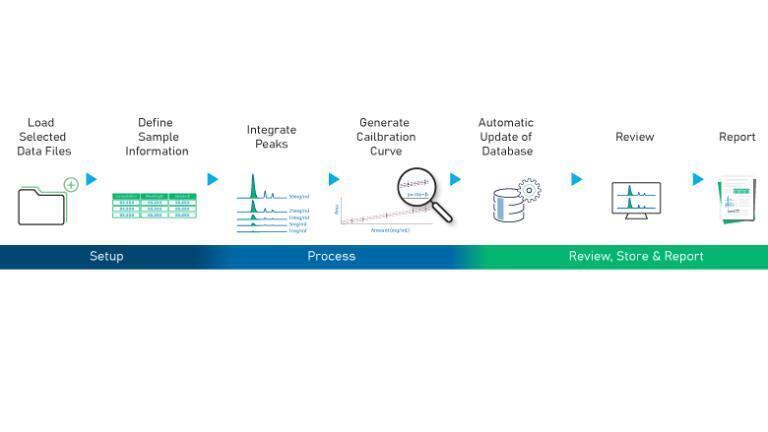
MS Workbook Suite offers a streamlined workflow to help quantitate unknowns against a set of standards to determine the quantity of analyte(s) present. Based on the parameters set, analyte response is measured, and data is quantified.
SET UP: Defining sample(s) information:
PROCESS: Processing parameters are defined and peaks for quantitation are identified via retention time. Peak detection/integration parameters are applied and a calibration curve with a regression line gets generated. Linear regression, standard deviation, and r2 are calculated.
REVIEW, STORE & REPORT: The full set of data (raw and processed) gets automatically saved to a database. In the processing interface, this data can be reviewed and modified (i.e., alteration of processing parameters, or the addition of unknowns to be quantified) and changes made are tracked for data integrity purposes. The analysis of residuals helps to determine the suitability and validity of the statistical regression model. Customizable reports can be created and shared.
Several challenges are encountered in quantitating xC/UV/MS data. A vendor-neutral software solution like MS Workbook Suite enhances efficiency, accuracy, and data integrity, facilitating the quantitation of unknowns.
ILM 51.5 July 2026


-(1).jpg)
.jpg)
.jpg)