Chromatography
Published over 12 years ago. See the latest and most current information on Chromatography.
Introduction
PAHs are a group of organic compounds consisting of two or more benzene rings and are often the byproduct of petroleum combustion. Due to their carcinogenic characteristics at relatively low concentra-tions, they are of particular environmental concern. Seven PAHs have been classified by the US EPA as probable human carcinogens and their toxic characteristics and persistent nature place them among the most extensively monitored organic contaminants.
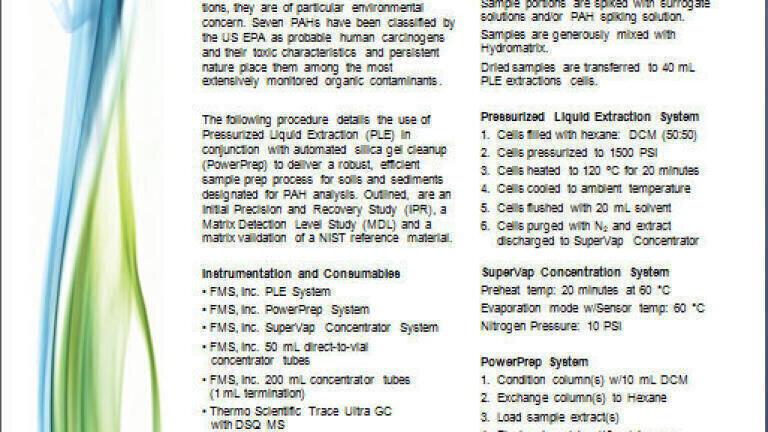
The following procedure details the use of Pressurized Liquid Extraction (PLE) in conjunction with automated silica gel cleanup (PowerPrep) to deliver a robust, efficient sample prep process for soils and sediments designated for PAH analysis. Outlined, are an Initial Precision and Recovery Study (IPR), a Matrix Detection Level Study (MDL) and a matrix validation of a NIST reference material.
Instrumentation and Consumables
Consumables
Procedure:
Sample Prep
Samples are weighed out in glass beakers.
For IPR and MDL samples, 20 grams of baked Ottawa sand was used.
Sample portions are spiked with surrogate solutions and/or PAH spiking solution.
Samples are generously mixed with Hydromatrix.
Dried samples are transferred to 40 mL PLE extractions cells.
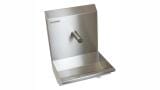
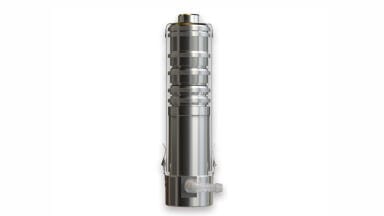
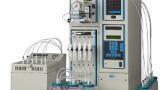
Pressurized Liquid Extraction System
Cells purged with N2 and extract discharged to SuperVap Concentrator
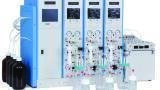
SuperVap Concentration System
Preheat temp: 20 minutes at 60 °C
Evaporation mode w/Sensor temp: 60 °C
Nitrogen Pressure: 10 PSI
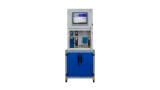
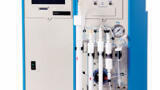
PowerPrep System
Results
Table 1. Results of four replicate IPR study (spiked at 500 µg/kg)
| Mean | STD | |
| Compound | Rec. | DEV |
| Naphthalene | 85.10% | 2.10% |
| 2-Methylnaphthalene | 91.50% | 2.00% |
| 1-Methylnaphthalene | 88.90% | 2.10% |
| Acenaphthylene | 101.50% | 1.90% |
| Acenaphthene | 96.50% | 2.50% |
| Fluorene | 96.90% | 3.30% |
| Phenanthrene | 89.10% | 4.60% |
| Anthracene | 116.90% | 4.50% |
| Fluoranthene | 102.60% | 5.90% |
| Pyrene | 101.10% | 5.60% |
| Benzo[a]anthracene | 97.40% | 4.60% |
| Chrysene | 104.70% | 5.10% |
| Benzo[b]fluoranthene | 90.00% | 7.10% |
| Benzo[k]fluoranthene | 95.20% | 3.70% |
| Benzo[a]pyrene | 89.50% | 3.70% |
| Indeno[1,2,3-cd]pyrene | 82.00% | 4.70% |
| Dibenzo[a,h]anthracene | 78.70% | 4.50% |
| Benzo[g,h,i]perylene | 83.30% | 4.40% |
| Nitrobenzene-D5 (Surr) | 93.60% | 6.10% |
| 2-Fluorobiphenyl (Surr) | 80.20% | 3.00% |
| p-Terphenyl-d14 (surr) | 81.70% | 5.20% |
Table 2. Results of NIST 1944 analysis (reported in mg/kg)
| Cert. | Calc. | |
| Compound | Value | Value |
| Naphthalene | 1.28 | 0.986 |
| 2-Methylnaphthalene | 0.74 | 0.589 |
| 1-Methylnaphthalene | 0.47 | 0.356 |
| Acenaphthylene | NA | 0.631 |
| Acenaphthene | 0.39 | 0.363 |
| Fluorene | 0.48 | 0.371 |
| Phenanthrene | 5.27 | 4.06 |
| Anthracene | 1.13 | 1.51 |
| Fluoranthene | 8.92 | 7.55 |
| Pyrene | 9.7 | 7.58 |
| Benzo[a]anthracene | 4.72 | 3.44 |
| Chrysene | 4.86 | 4.01 |
| Benzo[b]fluoranthene | 3.87 | 3.41 |
| Benzo[k]fluoranthene | 2.3 | 1.83 |
| Benzo[a]pyrene | 4.3 | 3.12 |
| Indeno[1,2,3-cd]pyrene | 2.78 | 2.26 |
| Dibenzo[a,h]anthracene | 0.42 | 0.445 |
| Benzo[g,h,i]perylene | 2.84 | 2.31 |
Table 3. Results of 7 replicate MDL study (spiked at 10 µg/kg)
| MDL | STD | |
| Compound | µg/kg | DEV |
| Naphthalene | 2.57 | 0.815 |
| 2-Methylnaphthalene | 2.82 | 0.905 |
| 1-Methylnaphthalene | 2.83 | 0.9 |
| Acenaphthylene | 2.93 | 0.93 |
| Acenaphthene | 3.4 | 1.08 |
| Fluorene | 1.19 | 0.38 |
| Phenanthrene | 3.38 | 1.08 |
| Anthracene | 2.83 | 0.9 |
| Fluoranthene | 2.68 | 0.85 |
| Pyrene | 2.22 | 0.705 |
| Benzo[a]anthracene | 3.96 | 1.26 |
| Chrysene | 4.89 | 1.56 |
| Benzo[b]fluoranthene | 1.97 | 0.625 |
| Benzo[k]fluoranthene | 3.22 | 1.03 |
| Benzo[a]pyrene | 1.78 | 0.565 |
| Indeno[1,2,3-cd]pyrene | 1.68 | 0.535 |
| Dibenzo[a,h]anthracene | 3.45 | 1.1 |
| Benzo[g,h,i]perylene | 4.63 | 1.47 |
Conclusions
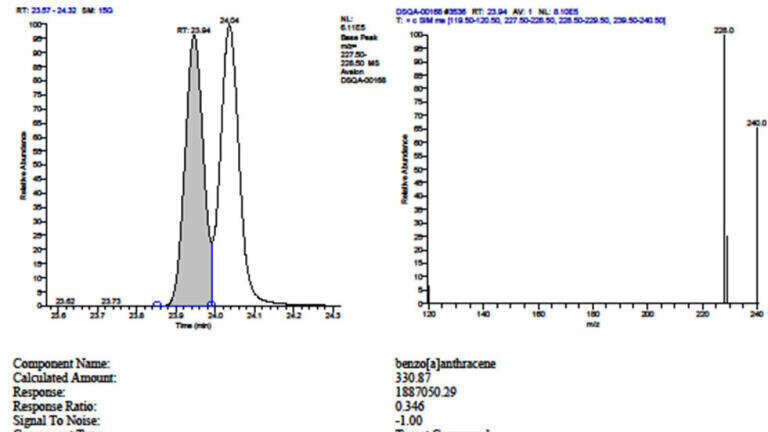
Following the extraction and cleanup with silica gel, the extracts were analyzed on a Thermo Scientific Trace GC with DSQ Mass Spectrometer. All analysis was performed in the selective ionization mode (SIM), with one quantitation ion and one confirmation ion monitored.
Figure 1. Ion spectra for benzo(a)-anthracene from analysis of NIST 1944, showing resolution from chrysene.
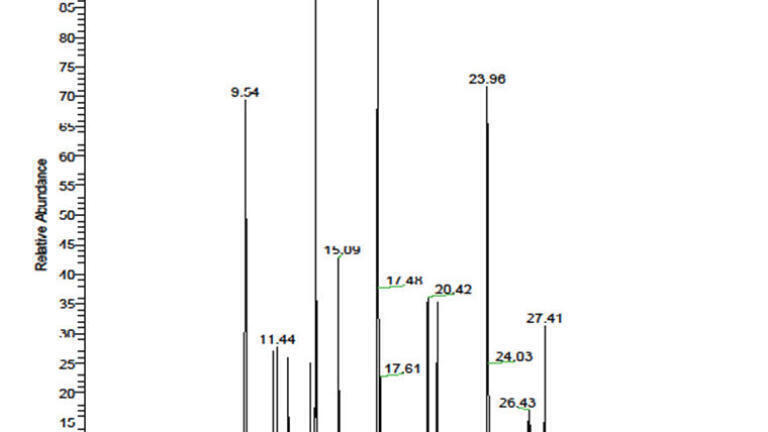
Analysis of the extracts showed excel-lent extraction efficiencies for all compounds analyzed, with minimal deviation between runs. The high level of efficiency enabled the establishment of an MDL below the target of 5 µg/kg for all analytes using the designated sample size. The calculated concentrations for the NIST 1944 sample were between 70-130% for all analytes, thus validating the PLE system extraction for soil and sediment sample. Due to the wide array of other organic contaminants present in the NIST reference sample, the efficiency of the 6 gram silica column was further validated by the clear resolution of each target analyte.
Figure 2. Total ion chromatogram from NIST 1944 analysis.
Using the FMS Pressurized Liquid Extraction system in conjunction with the PowerPrep Sample Cleanup system demonstrates an efficient and robust sample prep method that delivers both high quality results and increased sample throughput. By combining extraction, concentration and cleanup with direct-to-GC-vial concentration, this automated sample-to-vial process frees laboratory staff to perform other tasks which increases the lab’s throughput and quality and consistency of results.
For more information contact FMS at:
FMS Inc. Email: [email protected] or Web site: fmsenvironmental.com
Lab Asia 33.4 - August 2026


-(1).jpg)


-(1).jpg)
