Mass spectrometry & spectroscopy
Published over 5 years ago. See the latest and most current information on Mass spectrometry & spectroscopy.
Benchtop NMR instruments have brought convenient, fast sample analysis into many research and industrial chemistry laboratories, but while early applications largely focused on basic 1D 1H NMR spectra, modern spectrometers offer many additional capabilities. One important example is the ability to measure self-diffusion coefficients, which can be used to extract physical information about a sample including:
• molecular size
• viscosity
• ionic conductivity and transference (e.g. in lithium-ion battery electrolytes)
A benchtop NMR spectrometer equipped with Pulsed Field Gradient (PFG) hardware can use techniques such as the Pulsed Field Gradient Spin Echo (PFGSE) experiment to determine diffusion coefficients of sample components by measuring change in NMR signal as a function of the PFG strength. Adding variable temperature capability allows the study of sample thermal behaviour under a range of expected working conditions. Finally, a single broadband benchtop NMR system can analyse the behaviour of multiple components in the given sample, a crucial aspect in understanding physical and chemical properties.
In a liquid, individual molecules are not stationary; they are experiencing thermodynamic translational movements (Brownian motion is a classic example). Despite the randomness of such movements, the effective displacement (mean-squared displacement [x2]) of the molecules over the observation time td is non-zero. This is often described by the following equation for 3-dimensional diffusion:
where D is the self-diffusion coefficient (the value characterising the diffusion process) and td is the diffusion time (observation time). One simple way to visualise the thermodynamic diffusion process is to add a single drop of ink to a beaker of water, observing the gradual spread of the ink molecules.
The self-diffusion coefficient D can depend on a number of different properties of samples: the effective hydrodynamic radius of molecules in the solution, rH, the dynamic viscosity of the solution, ηη and the temperature of the sample, T. This relationship is given by the Stokes-Einstein equation:
where kB is the Boltzmann constant. Equation 2, above, becomes more complex if, during the diffusion time, the viscosity and the effective hydrodynamic radius are also varying.
NMR using pulsed field gradients can measure the diffusion coefficients of the various components in a sample. A PFG is exactly as the name suggests, a pulse of magnetic field that has a varying strength(a gradient) along a specific axis relative to the sample. When we apply a gradient pulse to a sample, we encode information (phase) into each molecule dependent on its position in the sample. Each part of the sample experiences a slightly different magnetic field due to the presence of the gradient. If we immediately applied an equal but opposite gradient pulse, we would encode the opposite of that information into those molecules and return them to their initial state.
However, if we instead waited a defined time, Δ, between the two gradient pulses, then those molecules would move slightly because of self-diffusion and would experience a slightly different magnetic field than they did initially. Therefore, they would not revert to their initial states. As shown in Figure 1, the result is a phase difference in respect to the time of the first and second gradient pulses.
We can use this spatial encoding and the resulting phase differences to measure the self-diffusion coefficient of the molecules in solutions.
Figure 1. The effect on the phase of molecules in solution due to applying two gradient field pulses with a) no delay between pulses and b) a delay of Δ between pulses.
The Pulsed Field Gradient Spin Echo experiment is a convenient method for measuring diffusion by NMR. In this experiment, pulsed field gradients are applied to the sample and varied in intensity. The pulse sequence diagram can be seen in Figure 2.
As shown in Figure 2, the experiment consists of 90° and 180° hard RF-pulses (orange) each of which is followed by a PFG pulse (blue). The PFG pulses have identical duration (δ) and intensity, which is varied during the experiment. Molecular diffusion induces its effect during the diffusion delay (Δ).
As the gradient strength increases, the signal is attenuated due to the changing phase difference between molecules after the first and second gradient pulses.
The attenuation can be related to the diffusion constant using the Stejskal-Tanner equation [1], one form of which can be seen below:
I and I0 are integrals of the spectral peaks with and without the applied gradient, respectively, D is the diffusion coefficient, and G is the gradient strength, while the remaining values are constant in the experiment (Δ is the diffusion delay, δ is the PFG pulse duration, and Y is the gyromagnetic ratio of the nucleus being measured). As a result, a plot of the natural logarithm of the peak intensities versus b-value allows a straightforward determination of the diffusion coefficient (D) from the slope of the diffusion decay.
Figure 2. Pulse sequence diagram of the PFGSE experiment. Rectangular hard pulses are shown in orange, and pulsed field gradients are in blue. Δ is the diffusion delay, while δ denotes the duration of the gradient pulses.
To demonstrate this concept, we used a simple example of the self-diffusion measurement of water. A PFGSE experiment was performed on a sample of neat water using fixed values for the PFG duration and diffusion delay, while the gradient field strength was gradually increased from 10 to 100% of the full gradient strength (for this instrument the maximum gradient strength was 0.3 T/m).
To demonstrate temperature dependence of the diffusion coefficient, the experiment was performed at two different temperatures, 18.7°C and 68.2°C. The resulting stacked spectra from these experiments are shown in Figure 3.
Figure 3. Stacked PFGSE spectra for water collected at varying pulsed field gradient strengths for samples at 18.7°C and 68.2°C.
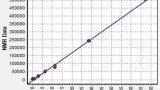
From these stacked plots it is immediately obvious that increasing gradient field strength causes a significant attenuation of signal intensity, as expected. The temperature effect is also very clear: the high temperature experiment shows completely suppressed signal at a relatively low gradient field strength. To calculate the diffusion coefficients, the peak areas from these stacked plots were determined and Stejskal-Tanner plots created as shown in Figure 4.
From these plots, the self-diffusion coefficient for water at the two different temperatures can be extracted from the negative of the slope as described above. In Table 1, the measured values of the self-diffusion coefficient are compared with those found in the literature for water [2], with excellent agreement.
Figure 4. Graphs showing A) the variation of spectral peak area as a function of gradient field strength and B) the Stejskal-Tanner relationship for water at two different temperatures.
Temp (°C) Dmeasured (x10-9 m2/s) Dreference (x10-9 m2/s)
18.7 1.96 1.95
68.2 5.44 5.45
In this application note we have briefly explained the concept of molecular self-diffusion and described its measurement using pulsed field gradient NMR on a benchtop instrument. Using the simple example of water, we have demonstrated how this powerful and versatile technique allows determination of the self-diffusion coefficient easily from a simple set of experiments. We have also shown how, by using a variable temperature probe, the measurements can reveal the temperature dependence of self-diffusion. The results clearly demonstrate the ability of modern benchtop NMR instruments to provide important information about the physical properties of samples, quickly and conveniently in any laboratory.
1. Stejskal, E.O., and Tanner, J.E., Chem. Phys. 42,288 (1965)
2. Holz, M., Heil, S.R., and Sacco, A., Phys. Chem. Chem. Phys., 2, 4740 (2000)
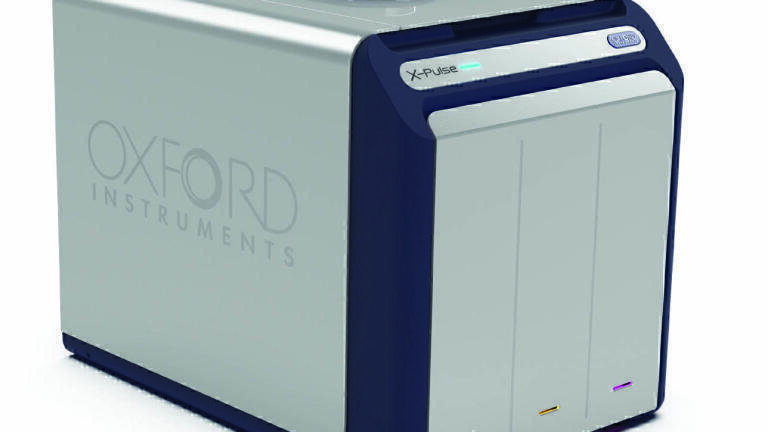
The X-Pulse benchtop NMR spectrometer provides all the necessary features to understand the physical properties of a range of sample chemistries. Pulsed field gradient hardware is standard. Available configurations allow variable temperature operation from 20 to 60°C and the ability to analyse multiple nuclei without switching the NMR probe, including 1H, 19F, and nuclei ranging in frequency from 29Si to 31P, such as 13C, 11B, 7Li, and 23Na.
Lab Asia 33.4 - August 2026


.jpg)


-(1).jpg)


.jpg)