Chromatography
Published over 4 years ago. See the latest and most current information on Chromatography.
S-Matrix Corporation, the developer of the Fusion QbD® Software Platform, announces new automated peak tracking features and capabilities to support Forced Degradation Studies. S-Matrix was the first company to develop closed-loop experiment automation for Chromatography Data Software (CDS) with integrated Design of Experiments (DoE) methodology for LC method development and validation. S-Matrix was also the first company to integrate true Monte Carlo robustness simulation into chromatographic method development and optimisation software.
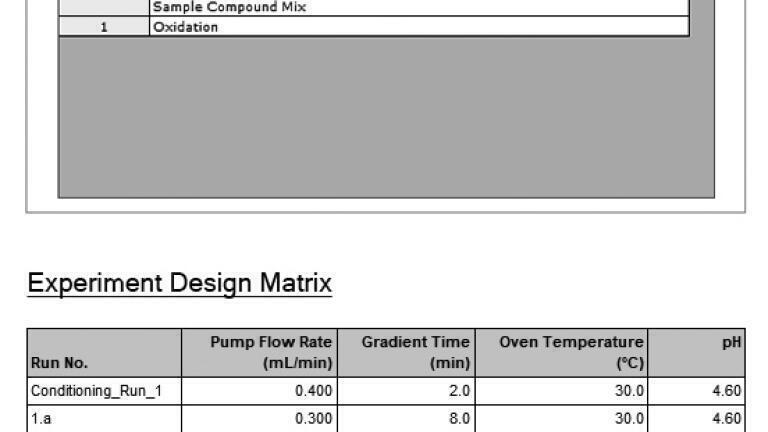
S-Matrix has now coupled its powerful PeakTracker™ technology for automated UV and MS spectra based peak tracking with a fully automated workflow for Forced Degradation Studies (FDS) within Fusion QbD. To engage the FDS feature you simply set up your method development experiment as usual, and then enter the degradation paths which yielded peaks in the simple setup window pictured in Figure 1. Note that in this example only the Oxidation path yielded degradant peaks. As also shown in Figure 1, Fusion QbD will automatically replicate each experiment run to accommodate the compound mix sample (the sample containing all expected peaks) and the additional degradation path sample(s). It will then automatically assign a separate autosampler vial position to each replicate injection when exporting the design to the CDS.
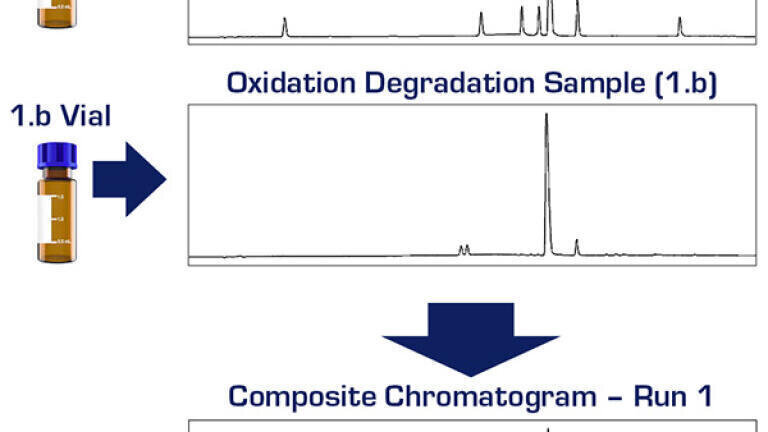
Once the experiment is run in the CDS, Fusion QbD will automatically import the results for each peak in each replicate injection for each experiment run. PeakTracker will then track all peaks in all replicate chromatograms for each run. Once the peaks are tracked, PeakTracker will generate a composite chromatogram for each run containing all unique peaks from the sample compound mix injection and from the replicate degradant path injections, as pictured in Figure 2. All peak results data for each included peak are automatically aggregated into the peak data set for the composite chromatogram generated for each experiment run, and this data set is then used for the rest of the experiment workflow, including data modelling, robust method optimisation, Method Operable Design Region (MODR) visualisation, and chromatogram simulation.
For further published presentations, articles and application notes from S-Matrix, please click here.
Lab Asia 33.4 - August 2026


-(1).jpg)


-(1).jpg)
