Chromatography
Published over 4 years ago. See the latest and most current information on Chromatography.
In 1980 the term ‘hyphenation’ was firstly coined by Hirschfeld [1] to denote the on-line combination of a chromatographic separation and one or more spectroscopic/spectrometric detection techniques. The marriage, to exploit the advantages of both, was driven by the constant need within the analytical community to push the boundaries of selectivity and sensitivity to tackle the continuously more challenging and demanding analytical applications.
Nearly 40 years down the line, hyphenated analytical techniques are now the favoured approach for complex qualitative and quantitative analytical problems.
Why is that the case?
The preference for hyphenation can be pinned down to three key advantages this approach can provide the analyst with:
• Convenience: the need for sample fractionation is overcome, reducing instrument and operator time
• Control: detection can be tailored to the chromatographic separation for instance by use of splitter plates (GC) or divert valves (LC)
• Consistency: full automation of online sample injection and sample introduction provides better performances when compared to manual handling
With hyphenated techniques such as GC-MS and LC-MS well-established techniques of choice, special attention is now devoted to systems in which multiple hyphenation- also known as hypernation- is an integral part of the whole setup, as discussed by Wilson and Brinkman in 2003 [2]. It’s within the perspective of hypernation that the on-line automation of sample preparation finds its perfect scope, as an additional yet extremely valuable hyphen. In fact, sample preparation is an essential part of any analytical workflow and despite the excellent performances of the latest available hyphenated techniques, superior quality data for complex matrices can only be achieved when counting on a robust and reproducible sample preparation.
The added values of hyphenated Automated Sample Preparation are the very same which drive the choice of hyphenation in the first place: Convenience, Control and Consistency.
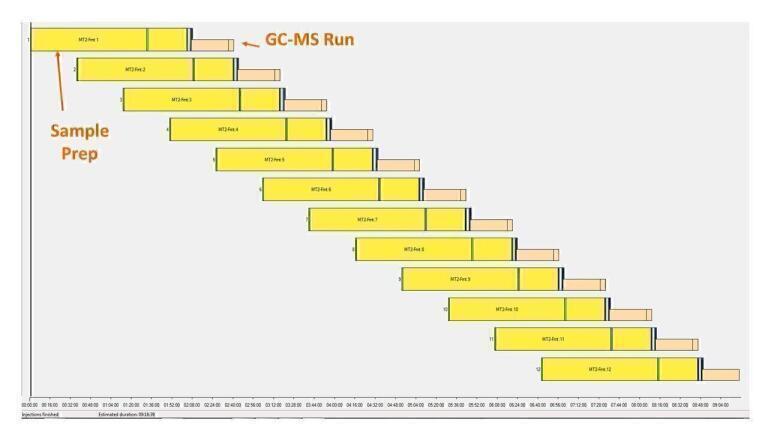
Let’s take as an example derivatisation and GC-MS analysis for untargeted metabolomics. Metabolomics investigates the metabolite composition of a certain sample, and this metabolic profiling can be carried out by two main approaches: targeted and untargeted. Targeted metabolomics focuses exclusively on the quantification of predefined sets of metabolites whilst untargeted metabolomics provides the global metabolic fingerprint. In GC-MS metabolomics, MOX-TMS is the most adopted derivatisation method. It’s a two-step derivatisation. The preliminary methoximation step (MOX) allows reaction of carbonyl groups to form oxime. This step is crucial to prevent processes such as cyclisation of reducing sugars, formation of keto-enol tautomers and decarboxylation, with the final scope to reduce the complexity of the chromatograms due to presence of multiple peaks per metabolite. The successive silylation reaction (TMS) replaces active hydrogens present in the molecule of interest with an alkyl silyl groups. Silylation is not only useful to improve GC chromatographic properties of the analytes, but it also enhances mass spectrometric properties providing diagnostic fragmentation patterns for structure elucidation. The standard workflow requires 2 hours of sample preparation plus GC run times between 40 min and 1 hr. Noteworthy, TMS derivatives are sensitive to moisture, and they tend to degrade overtime, so it is quite crucial to run the samples freshly derivatised. When using automated sample preparation, it is possible to multitask. Sample preparation for each sample is performed immediately preceding the GC-MS injection whilst the previous sample is running. Figure 1 shows the timeline for the preparation and analysis of 10 samples when using hyphenated and automated sample preparation.
The multi-coloured bands represent the sample preparation, and the light orange bands the GC run-time. Automated sample preparation not only offers a very convenient option, significantly eliminating operator downtime, but also ensures that freshly derivatised samples are analysed promptly reducing the risk of degradation.
Figure 1. The timeline for the preparation and analysis of 10 samples when using hyphenated and automated sample preparation.
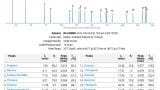
Full automation of an untargeted approach to investigate the metabolic diversity of fungal endophytes was performed in support of a grant application for a customer. Six replicates of three species of endophytic fungi (3, 11 and 21) were analysed plus 3 procedural blanks for a total of 21 samples. Deconvoluted data were processed using several statistical tools to identify key markers for the three fungi species. Figure 2 shows the obtained Principal Component Analysis Plot, an effective visual way to explore the variance in the data set and support identification of patterns. The three fungi species and the procedural blanks separated nicely in different tight clusters.
Figure 2. The obtained Principal Component Analysis Plot.
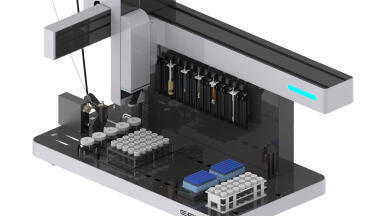
SmartSPE® is an emblematic example of the power of controlled automated sample preparation. In fact, one of the main limitations of manual SPE is the lack of flow control (the famous so to speak ‘drop rule’). This flow variability often translates in absolute recovery variability. On the contrary, the automation of online SPE using ITSP (Instrument Top Sample Preparation) single use miniaturised cartridges allows extremely precise flow control (down to 0.1µL/s), and this attains chromatographic performance which is not accessible with a manual method. Miniaturised cartridges are packed with customised sorbent to match the material in the standard size SPE cartridges. They come in a 96-well format, and they are handled by the robotic platform by means of the syringe needle. In SmartSPE® flow profiles follow the expected Van Deemter curves with clearly defined optima [3] as shown in Figure 3.
Figure 3. The SmartSPE® flow profiles follow the expected Van Deemter curves with clearly defined optima.
As an outcome of the accurate flow control, absolute recoveries of >99% can be achieved along with a significant reduction in background matrix. The importance of flow control is even more crucial when using ion exchange SPE. In fact, according to the flow optimisation studies done by Hayward, the range of optimal flow is much narrower, and recovery can drop drastically if that optimum is not met. Controlled automation of smart SPE-GC-MS was applied to the determination of four forensically relevant opiates in blood. Opiates encompass both natural and semi-synthetics alkaloids. They are found in the opium poppy plant and are used for the treatment of acute pain. Unfortunately, they are highly addictive and are therefore considered globally as drugs of abuse. The manual workflow involves an initial protein crash, a cation exchange SPE to enrich analyte concentration and reduce matrix interference followed by evaporation and silylation prior to GC-MS analysis. For this study, spiked blood samples were prepared and extracted using SmartSPE® and then injected directly onto the GC-MS. Sample batches included blanks with internal standard and five calibrators which were prepared over three separate days to evaluate robustness and reproducibility. Linearity was excellent and error bars showed particularly good inter days variability. Recoveries were above 90% and signal to noise at the lowest calibration point was above 10 for all analytes except for 6-MAM.
Consistency is a key requirement for analytical approaches which use data analytics to drive method development and data mining. Hence, automation offers a strong synergism with many valuable data analytics tools. Design of Experiments (DoE) is a systematic approach to determine the relationship between factors affecting a process and the output of that process. Once the relationship between the factors and the process has been established, this information can be used to optimise the response. It must become clear how essential is a consistent control of the factors to reduce to the minimum analytical variability. In fact, high analytical variability would mask the information produced by the investigation of the experimental space. This example describes the use of automation to perform design of experiments. DoE was used for the optimisation of fatty acids derivatisation to picolinyl derivatives. Derivatisations often involve optimisation of several parameters to achieve the best performances and therefore they offer a very good situation for DoE to shine. Traditionally, fatty acids are analysed by GC-MS using their methyl ester derivatives (FAMEs). However, FAMES mass spectra cannot provide ions indicative of structural features such as double bonds and branch–points. On the other hand, fatty acids picolinyl esters are a better option for structural elucidation. In these derivatives, it’s a nitrogen atom to carry the charge rather than the alkyl chain and this aspect minimises double bonds ionisation and migration, helping to provide very informative structural information. To perform the DoE, four factors were chosen together with their respective range and picolinyl derivatives peak area were chosen as responses. DoE generates a matrix of experiments where trials are run at all possible combinations of all factors settings. The response is recorded for each of the experiments. Using of hyphenated and automated sample preparation makes the experimental side of any DoE conveniently and consistently delivered. As a standard DoE approach, firstly scoping trials were performed to estimate the experimental random variation and evaluate the experimental design space. The scoping trials usually comprise a minimum of four trials: low, where all variables are set at the lowest level, centre points where all variables are set in the middle of the experimental range and high where all variables are set at the highest level. Centre points allow to evaluate for non-linearity and random variation. The pilot trials confirmed significant variability in the experimental space worthwhile to further investigate. Secondly, screening designs were used to differentiate significant factors and find existing interactions between factors. Statistical tools helped with the interpretation of the results. The screening design highlighted a significant effect of temperature suggesting quadratic behaviour. To confirm the trend, an optimisation step was conducted to finalise the relationship between the different factors and the response. Once the optimal conditions were confirmed, the process was run in these conditions in replicates to assess robustness and variability. Figure 4 shows the results for repeatability and reproducibility obtained for a fatty acid mixture C4 to C22.
Figure 4. The results for repeatability and reproducibility obtained for a fatty acid mixture C4 to C22
A certain variability across the range of alkyl chain could be observed but this is understandable since the optimal conditions were selected as the best compromise across the whole target responses.
Automated sample preparation is an immensely powerful analytical tool which lends itself to several synergic combinations which can deliver remarkably high performances at different stages of the analytical workflow. Sample preparation and method development are essential yet incredibly challenging analytical aspects which can benefit significantly from the use of automation. In fact, the appeal of automation doesn’t lie exclusively in very good method robustness and batch-to-batch reproducibility. The extremely accurate flow control in liquid handling and the ability to control timing accurately (e.g., incubation time for derivatisation purposes) open the doors to what could be considered ‘high performance’ sample preparation. Convenient, control and consistency make indeed hyphenated automated sample preparation the missing hyphen to any system hypernation.
1. Hirschfeld, T. Analalytical Chem. 1980, 52, 297A−312A
2. Wilson I.D. et al., J. Chromatogr. A, 2003, 1000(1-2): 325-326
3. Hayward M. et. al. Am. Lab., 2016, 48(7): 14-17.
ILM 51.5 July 2026


-(1).jpg)


-(1).jpg)
.jpg)