Chromatography
Published over 6 years ago. See the latest and most current information on Chromatography.
Recent estimations indicate that there are over 50 million electronic cigarette users worldwide, mostly as an alternative to cigarettes. However, some Asian countries including India, Cambodia and Thailand now have banned the use and importation of e-cigarettes and e-liquids. Shenzhen in China has banned the smoking of e-cigarettes in public even though 85% of the e-cigarette manufacturers are located in this region. In the USA, regulations are being put in place following the recommendation of the US Centers for Disease Control and Prevention following a spike in unexplained lung illnesses among e-cigarette users [1]. China’s National Health Commission plan to regulate e-cigarettes through new legislation to address the additives in e-liquid products that may pose health risks to users.
Basic regulations for e-cigarettes currently in place, worldwide, are generally based on existing conventional tobacco product laws. As such, they are focused on the concentration of nicotine, caffeine and taurine rather than on flavourings and specific impurities as applicable. Current e-liquids typically only list three ingredients that are present on their packaging; Propylene Glycol (PG), Vegetable Glycerin (VG) and Nicotine. The list of impurities and critical compounds that should be absent in e-liquids is longer: Formaldehyde, Acetaldehyde, Acrolein, Diacetyl, Acetyl Propionyl, Acetoin, Diethylene Glycol, Ethylene glycol, and Acetoin.
SCION Instruments developed a method for the quick and easy compositional analysis of e-liquids by gas chromatography with mass spectrometry. Along with vendor-listed compounds, various flavour compounds and impurities were identified.
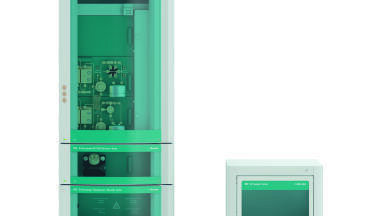
A SCION 436 was coupled with the SCION Single Quad Mass Spectrometer and 8400 Autosampler. Mass Spec WorkStation (MSWS) software was used for instrument control, data acquisition, data processing and spectral library comparisons. Table 1 details the analytical conditions of the GC-MS system. All e-liquid samples were injected neat and with a 1 in 2 dilution (in methanol).
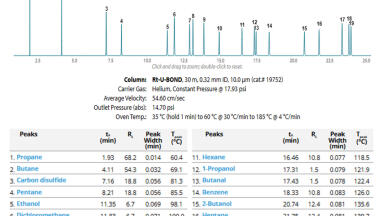
Table 1. Analytical conditions of the GC-MS
Conditions
S/SL 220°C, Split 1:10, 0.1μL
Column Scion-5MS 30m x 0.25mm x 1.0μm
Oven 40°C (5 mins), 10°C/min to 220°C (5 mins)
Carrier Gas Helium 1mL/min constant
Transfer Line 250°C
Source 230°C
MS Full Scan, 45-500amu, Scan Segment
PG/VG mixtures, as the base components of all e-liquids, are challenging to analyse by GC as they are very viscous and are easily overloaded on the analytical column. Overloading the column results in poor chromatography which may potentially mask other sample components near the PG/VG peaks.
To overcome these issues, all samples were diluted in methanol (1in2) and a scan segment method was utilised to minimise the amount of base PG/VG components detected. The scan segment method is acquired in MSWS; as well as a standard full scan acquisition the scan segment method allows user-defined scan programmes to eliminate the issues associated with propylene glycol and vegetable glycerin. During the time scan segment for PG/VG respectively, the first detected mass of both target compounds was increased in order to reduce the amount of base component being identified.
Pure nicotine was used to prepare a calibration curve for the quantification of nicotine in all e-liquids. Calibration standards were at 0.5, 1,3,5 and 10mg in methanol.
Four commercially available e-liquids were purchased locally. Flavour profiles of these four bottles were labelled as bubble-gum, pear drop, cherry tree and blueberry. Nicotine contents were listed as 6mg, except for the blueberry which was labelled at 3mg of nicotine. Bubble-gum, pear drop and cherry tree all had a PG/VG ratio of 70/30 whereas blueberry was made up of 60/40 PG/VG.
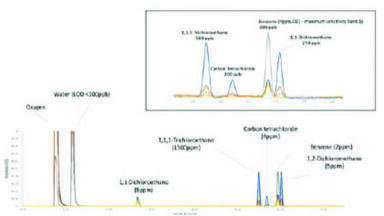
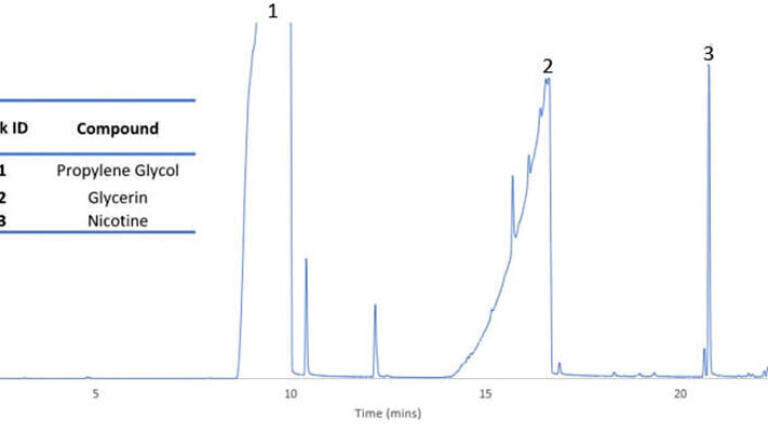
All neat and diluted e-liquids were analysed using both the original full scan and optimised scan segment method. Figure 1 details the chromatogram of the neat injection of the bubble-gum e-liquid with no scan segment acquisition whilst Figure 2 details the diluted bubble-gum e-liquid with the scan segment acquisition. Both chromatograms are representative of all e-liquid samples, with and without scan segment acquisition.
Figure 1 shows clear column overloading of the PG and VG peaks whereas Figure 2 shows that with scan segment acquisition, and sample dilution the overloading is removed. Additionally, using the scan segment acquisition allows identification of previously masked peaks without the need for extensive sample preparation or method development.
NIST library searches were completed on all samples in order to identify the various impurities and flavour compounds. Common impurities and the unwanted compounds previously listed were targeted during a NIST library search of their mass spectra. None of the listed compounds were found in any of the four e-liquids analysed.
Table 2 details key compounds and their associated flavours identified in all e-liquids. + represents a positive identification, x represents a negative identification.
Compound Flavour Bubble-Gum Pear Drop Cherry Tree Blueberry
Anise Camphor Liquorice x x + x
Butyl Acetate Apple/Banana x + x x
Butyl Isovalerate Banana x x x +
Citral Lemon + x x x
Ethyl Butyrate Pineapple + x + +
Ethyl Isovalerate Pineapple x x x +
Ethyl Vanillin Vanilla + + + +
Eugenol Cinnamon + x x +
Isoamyl Acetate Banana + + + x
Linalool Acetate Lemon/Mint + x x +
Maltol Caramel + x x +
Menthol Mint + x x +
Piperonal Cherry x x + x
Vanillin Vanilla + + + +
γ-decalactone Peach + + + +
γ-terpinene Lemon x x x +
Three flavour compounds were identified in all samples; Ethyl Vanillin, Vanillin and γ-Decalactone which are responsible for vanilla and peach flavours respectively. All other flavours identified were not shared among all samples, but most can be associated with and expected from with the commercial description of the e-liquid flavour profiles.
The nicotine calibration curve can be found in Figure 3. Nicotine has excellent linearity on the SCION 436 GC with SQ MS.
The MSWS software was used to calculate the concentration of each e-liquid. Figure 4 details the target and actual concentrations of the e-liquids. Manufacturing regulations do not stipulate how accurate the actual concentration must be, rather than the amount of nicotine in the e-liquids must not be greater than 20mg. Variance in concentrations were observed in bubble-gum (-7%), pear drop (+5%), cherry tree (-1.7%).
SCION Instruments developed an analytical method for the composition analysis of e-liquids including flavours and impurities. The SCION 436 GC with Single Quad Mass Spectrometer was used to analyse four commercially available e-liquid samples. A full scan segment method was developed to remove matrix interferences and enable the identification of previously masked peaks. Although no e-liquids exhibited the exact same flavour profile, common flavour compounds were present among samples such as vanilla and peach. NIST library searches confirmed that no unwanted impurities were present in any of the samples. Additionally, variance in nicotine content between listed nicotine concentration and calculated nicotine concentration of all e-liquids was calculated.
1. Centers for Disease Control and Prevention. 2019. Outbreak of Lung Injury Associated with the Use of E-Cigarette or Vaping Products [ONLINE] Available At https://www.cdc.gov/tobacco/basic_information/e-cigarettes/severe-lung-disease.html (Accessed 28/10/19)
ILM 51.5 July 2026


-(1).jpg)


-(1).jpg)
.jpg)