News
Published over 4 years ago. See the latest and most current information on News.
This article examines if sigma values are the best metric (or even an acceptable metric) to manage RISK in laboratories. Can sigma metrics be converted to risk, defined as “the combination of the probability and severity of harm?”1
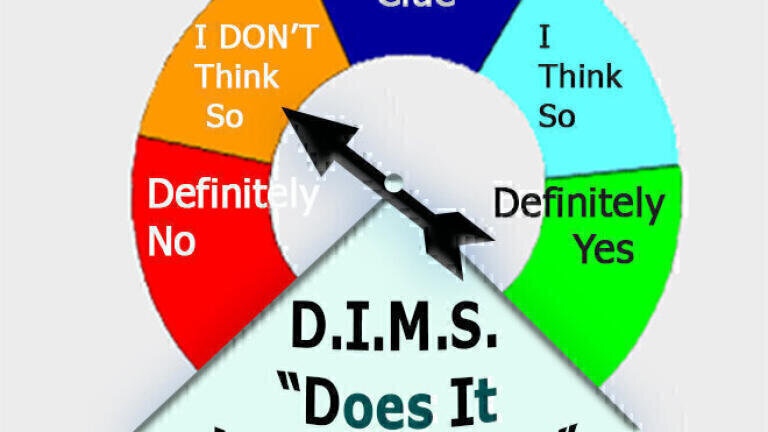
Challenge yourself as you read to apply “The DIMS Test (Does It Make Sense?) to the theory, and practice of sigma metrics in risk management.
The pioneer of Six Sigma, Motorola, built pagers that did not require testing prior to shipment to the customer. Only approximately 3.4 pagers out of a million shipped did not function properly when the customer received it, which they equated to a long-term stable manufacturing process where it would require a deviation of six SD from the current mean value to reach the failure limit.2 That is not actually true; they subtracted 1.5 SD from the measured sigma to allow for long term drift in the system.3 Six sigma actually translates to about 2 defects per billion opportunities, and 3.4 defects per million opportunities corresponds to a sigma value of 4.5. Before you measure sigma, consider asking: “What decisions do you make based on sigma values?” “Do you care about the process quality now, or are you interested in an average performance over the year(s)?” “DIMS to apply the shift in performance of 1.5 SD observed at Motorola in 1986 to represent performance of your laboratory methodology in 2021?” “Is there scientific proof of this shift in your laboratory instrumentation?”
Manufacturing processes often create millions of products (opportunities for defects) each year, approximately 3,000 per day. Laboratories, in contrast, may create results (opportunities for defects) on fewer than one hundred samples each day. Manufacturing settings calculate sigma on measurements of all the actual products they create; labs frequently calculate sigma on only a few daily replicates of surrogate samples that are assumed to mirror the accuracy and precision of the samples reported to clients. DIMS that, despite these fundamental differences, laboratories have loosely adopted acceptable sigma values from manufacturing, with a desirable target of six sigma and minimum sigma metric for a clinical lab assay of 3.04. Should acceptable standards for medical laboratories be based on clinical need or manufacturing standards? DIMS to set acceptable standards for other laboratories based on client need?
In manufacturing settings, the process to determine sigma is: 1: Define Your Opportunities, 2: Define Your Defects, 3: Measure Your Opportunities and Defects, 4: Calculate Your Yield, 5: Look Up Process Sigma. In laboratory settings, sigma is calculated as [(Tolerance Limit -|Bias|)/SD] or [(Tolerance Limit as %-|Bias as % of Tolerance Limit|)/CV%]. These two formulae do not produce the same results when bias is present. Consider a measurement process as shown in Table 1.
The true or target value for the quality control sample is 100 units and Tolerance Limit or allowable error limit is 12 units. With a positive or negative bias of 6 units, sigma = 3.0 when calculated from units of measure. When the same data are converted to percent, sigma is calculated as 2.8 when bias is negative, and 3.2 when bias is positive. Every elementary student learns that you cannot add fractions with different denominators; DIMS to change the rules for laboratory management?
Table 1 Negative Bias Positive Bias Zero Bias
Units Percent Units Percent Units Percent
Allowable Error 12.0 12.0% 12.0 12.0% 12.0 12.0%
True/Target 100.0 100.0 100.0 100.0 100.0 100.0
Mean 94.0 94.0 106.0 106.0 100.0 100.0
Absolute Bias 6.0 6.0% 6.0 6.0% 0.0 0.0%
SD or CV% 2.0 2.1% 2.0 1.9% 2.0 2.0%
Sigma 3.0 2.8 3.0 3.2 6.0 6.0
Sigma metrics include the sigma value and Defects per Million Opportunities (DPMO). Sigma values can be converted to, or derived from, DPMO using a variety of online calculators5,6 and tables 7,8 Despite these resources, a LinkedIn poll completed by 38 laboratory professionals in September 2020 (Figure 2) shows significant disagreement in the conversion of 3-sigma to DPMO. Only 23% realised that the correct answer was either 1,350 or 2,700 errors/year, depending on the presence of absence of bias. Fifty-four percent thought there were over 66,000 errors per year, probably because they used an online table that included the “sigma shift.” DIMS to both consider 3 sigma acceptable and believe that 3 sigma equates to 66,807 DPMO – a failure rate of 6.7%? DIMS to report 6.7% of measurement results to clients as ‘good’ when they are actually ‘bad’? What potential harm would your client suffer?
Risk evaluation is “the process of comparing the estimated risk against given risk criteria to determine the acceptability of the risk.9” Figure 3 shows results for 101 glucose quality control sample results from 43 analytical processes based on actual data obtained by the author for a series of posters10,11,12. Examination of sigma values [A] would identify seven samples below 3-sigma (calculated from units, not percent.) This would lead people to “consider the need for more QC materials or runs for proper quality monitoring or for assay or process improvement to reduce bias and imprecision.“4 DIMS to increase the number of QC samples when this does nothing to improve the method? People are left to determine if the problem is with accuracy or precision. The two lower graphs, modified from reports from CatalystQC™ software from AWEsome Numbers Inc.13, identify eleven QC samples that fail acceptable risk criteria specified as the number and cost of error. An additional 24 samples require improvement because they are close to failing acceptable risk limits based on the [B] number of errors per year and [C] clinical cost of avoidable follow-up tests and treatment – probability or severity of patient harm. In this case study, patient test populations were normalised to 100 samples per day, 36,500 per year. Over 85% of these analytical processes were producing less than one medically-unreliable result (MUR) per year. The acceptable numbers of error per year based on 3 sigma is 49. DIMS to allow 49 errors per year based on manufacturing standards, when most medical laboratory processes are capable of producing only one MUR/year?
Within the medical laboratory, it has been established that the cost of follow up tests and patient treatment is proportional to the size of error.14 Similar situations may occur in other setting where the value of the product measured decreases as error increases. Figure 4 illustrates that a 6-sigma process with zero bias [A] would have an average clinical cost of error of $18.70 while another 6-sigma method [B] with significant bias would have an average cost of $55.00. DIMS to manage risk with a metric that is not capable of reflecting severity of harm?
Figure 5 shows method bias% and CV% for the 101 glucose QC samples discussed above.Samples identified as “To Improve” have a number or cost of error that approaches, or exceeds, the acceptable risk criteria. In this case study, acceptable number of errors was set at 49 MUR/year, calculated as 36,500 x 0.135% to represent common practice of considering 3-sigma to be acceptable. Acceptable average cost of error was set at $40. The lower graphs show performance with modeled improvement of the %bias and CV% in identified samples to the average of the samples with acceptable performance.Investigate these & method-specific faults to improve accuracy or precision:
calibrator deterioration A
reagent lot change or deterioration A
use of expired reagents A
changed measuring system settings A
spectrophotometric drift A
routine maintenance or cleaning A/P
external maintenance A/P
changed handling of reagents A/P
contamination - sampling & dispensing P
patient sample carryover P
inconsistent sample volume P
While sigma values can alert staff to improve either method accuracy or precision, software now exists that can differentiate the specific improvement required and direct staff to take appropriate action. Table 2 is a sample list of typical causes to investigate to improve [A] Accuracy and/or [P] Precision. This list can be modified in software for specific analytical processes. SOPs can describe the steps to correct the identified cause of increased risk. All staff can be guided to consistent interpretation and action.
Risk management software guides reduction in the number and cost of lab error.
The 101 glucose QC samples in this study control the risk (number and cost of error) for 3.7 million patient samples. If the laboratories can improve method accuracy and precision to meet the majority of peers, they can prevent 3,615 medically unreliable results and save $17.2 Million in clinical care costs.
Risk is “the combination of the probability and severity of harm.”1 Number of errors per year is a more meaningful reflection of the probability of harm in laboratories than Defects Per Million Opportunities (DPMO.) Values from sigma tables are not accurate in methods with zero or little bias. Cost of error is proportional to size of error; sigma values cannot be converted to cost. It makes sense for laboratories to use risk management software to reduce the number and cost of harm for their clients by following software-guided improvement to meet peers.
1 EP 23A Laboratory Quality Control based on Risk Management, Approved Guideline. CLSI Document EP23-A. Wayne PA: Clinical and Laboratory Standards
2 https://www.isixsigma.com/new-to-six-sigma/sigma-level/should-you-calculate-your-process-sigma/
3 https://www.isixsigma.com/new-to-six-sigma/dmaic/15-sigma-process-shift/#:~:text=Using%20this%20table%20you’ll,a%20sigma%20value%20of%204.5.&text=This%20difference%20is%20the%201.5%20sigma%20shift.
4 https://www.aacc.org/cln/articles/2020/april/the-case-for-six-sigma-in-lab-quality-management-systems
5 https://www.westgard.com/six-sigma-calculators.htm
6 https://www.isixsigma.com/process-sigma-calculator/
7 https://www.westgard.com/sixsigtable.htm
8 https://www.moresteam.com/toolbox/six-sigma-conversion-table.cfm
9 ISO 14971 Medical devices - Application of risk management to medical devices https://www.iso.org/standard/72704.html
10 https://www.researchgate.net/publication/290607153_Benchmarking_Laboratory_Quality
11 https://www.researchgate.net/publication/281870192_The_Business_Case_for_Optimized_Quality_Control_Practice_AACC_2012
12 https://www.researchgate.net/publication/281870223 Evaluation_of_Quality_OptimiZer_Software_to_simplify_application_of_CLSI_EP_23-A_minimize_patient_risk_and_reduce_clinical_cost
13 https://awesome-numbers.com/
14 National Institute of Standards and Technology. Planning Report 04.1. The impact of calibration error in medical decision making. 2004. http://www.nist.gov/director/prog-ofc/report04-1.pdf .
Zoe Brooks, CEO and co-founder of AWEsome Numbers Inc. has worked on the front line in all major laboratory departments, been a laboratory manager, provincial inspector, regional technical specialist, private laboratory regional manager, author, teacher and now an entrepreneur. The DIMS Test was developed teaching an online Master’s course at Rutgers University. She programmed quality management software in 1990 to address the problems she encountered trying to bring effective quality control to six rural laboratories. Zoe has dedicated her life to the improvement of quality on medical laboratories and believes that CatalystQC™ software can make a huge difference in the global cost of healthcare. Email: [email protected]
ILM Guide 2026/27