SigmaPlot 10, the latest version of the Systat Software scientific graphing and data analysis package, from Systat Software GmbH, presents a wide range of new graphing options and many workflow efficiency improvements to streamline the graph creation and publication process and to provide greater flexibility for field and lab data analysis. Included as well are new features and enhancements to the curve fitting engine such as a new ROC Curve Analysis Module to determine the best clinical test.
Graphing enhancements
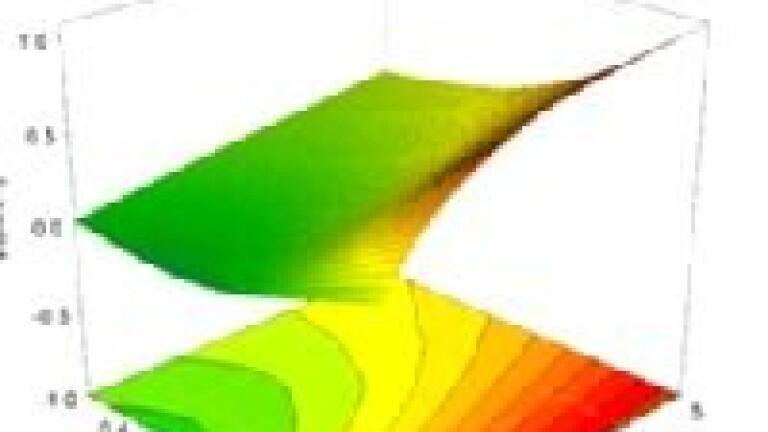
An increase in the number of line types and fill patterns supports the differentiation of groups within data to easily highlight trends. New 3D mesh plots including contours enhance the visualization of three-dimensional datasets by projecting values on either of the X-Y plane. In order to quickly generate accurate mesh and contour plots from any 3D data sets irregularly spaced three-dimensional data are automatically interpolated and graphed. Graph objects are more easily selected for customization now, even when buried beneath other items. New Weibull and reciprocal (Arrhenius) scales further enhance the display of different distributions. As well, all new axis scales are available for 2D and 3D contour plots.
Additional data analysis options
A new Dynamic Fit Wizard complements the Regression Wizard to find the best solution to difficult curve fitting problems. Further new data analysis features include automatically generated confidence and prediction bands for curve fits, a new ROC Curve Analysis Module to help determine the best clinical test and 12 new probability functions for the easier calculation of hypothesis tests, for instance.
New General Features
A valuable help for SigmaPlot 10 users is the new real-time mouse feedback of graph coordinates, which gives the current coordinates of the graph or of data plotted while the user moves the cursor over the graph. A new Submission Assistant checks submission articles to make certain they meet the publication specifications of leading journals. The new Audit Trails allow users to easily track and log changes to notebooks and login names in compliance with 21 CFR Part 11. Direct SAS and Minitab data file import and the ability to import popular graphic files (BMP, JPEG, GIF, TIFF, etc.) directly to the SigmaPlot graph page extend the SigmaPlot import options.

.jpg)


-(1).jpg)
.jpg)