Laboratory products
Published over 15 years ago. See the latest and most current information on Laboratory products.
Systat Software, Inc released SigmaPlot 12, the latest version of their most advanced scientific data analysis and graphing software package. SigmaPlot 12 provides researchers with an enriched user interface, increased ease of use and new features to quickly analyse data and create exact, publication-quality graphs that best present research results for presentation, publication or the web.
Unlike spreadsheets, business graphing and other data analysis software packages, SigmaPlot 12 is specifically designed to meet the needs of professional researchers. This latest version contains many workflow efficiency improvements, new enhancements to SigmaPlot’s curve fitting features and a wider range of graphing options including radar and dot density graphs. Every detail of their graphs may be easily customised for effectively communicating the most important elements of their research.
SigmaPlot 12 contains many new features to simplify and streamline the graph creation process - from importing data to publishing research results. Some of the more notable general features include: graph object grouping with Microsoft Office style ribbons; new property browser with immediate graph update upon object modification; user interface improvements: tabbed windows with possible tab groups, mini-toolbars for modifications directly on the graph or worksheet or report and a customisable Quick Access Toolbar; worksheet improvements with formatted text in worksheet cells; and report improvements with new pre-defined style tables.
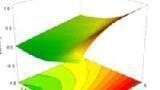
Research scientists and engineers will benefit from many new graphing enhancements for customising the plot area: radar graph; dot histogram graph; ScaleGraph macro for scrolling through data; improved and additional graph page navigation controls with pan via hand cursor and mouse wheel scrolling; line anti-aliasing, color gradients and object transparency; and Bland-Altman graph for method comparison.
Additional data analysis capabilities deliver even greater control and flexibility to confidently analyse both field and lab data. Users can access 100 of the most frequently used statistical procedures for analysing scientific research directly from the SigmaPlot statistics menu with easy-touse, step-by-step guided statistical analysis for scientists who are not statisticians.
ILM 51.5 July 2026

.jpg)


-(1).jpg)
.jpg)
.jpg)


.jpg)