Mass spectrometry & spectroscopy
Published over 13 years ago. See the latest and most current information on Mass spectrometry & spectroscopy.
Raman spectroscopy has rapidly established a foothold as a very useful technique for chemical analysis, especially because of the strong specificity of the Raman signature of many materials. In addition, Raman analysis is nondestructive, requires very limited sample preparation, and allows for sample volumes in the microlitre range.
Recent advances in Raman development include better filtering technology to enable steeper and deeper blocking of the laser and fluorescence background, and the emergence of sophisticated chemometrics software to extract more information from the generated spectra.
Although Raman spectroscopy is an excellent analytical tool, Raman signals are often weak (for most molecules, only one Raman photon is generated from about one million laser photons) and traditional slit spectrometers typically have poor optical throughput, limiting their effectiveness in low light level setups. Throughput is further limited by traditional spectrometer slit designs, which act to maintain high optical resolution but at the expense of signal level. A recently developed spectrometer design that incorporates high throughput virtual slit (HTVS) technology helps to eliminate trade-offs between sensitivity and resolution and thus enhance overall system performance.
Dispersive Spectrometers and Optical Resolution vs. Throughput
In typical dispersive spectrometers, the core design decision for the optical bench is how best to optimise the combination of wavelength range, optical resolution and system sensitivity. The optical bench directs broadband light through a narrow entrance slit onto a diffraction grating and focuses the spectra onto a detector array. The wavelength range will depend on the groove density of the grating and the details of the bench and detector. You can achieve a greater range for a given optical bench and detector setup by decreasing the grating groove density. For example, in a crossed Czerny Turner optical bench anchored by a 3648-element CCD linear array, a 600 line mm-1 grating will cast a ~650 nm spectra across the active area of the detector. By rotating the grating, the beginning wavelength – and thus spectral range -- can be varied. If you use a 1200 line mm-1 grating, then the light is diffracted at twice the angle and the detector will intercept half the wavelength range. With everything else held constant, the optical resolution would be twice as fine. But because the light is spread out over twice the angle, the light falling on each pixel is half as bright and the signal per pixel will be half as great.
Optical resolution depends on the grating and wavelength range and the aperture size or slit width. The optical bench focuses the slit image onto the detector plane, so that monochromatic light will fall across all the pixels illuminated by the slit image (Figure 1). The width of this image is measured typically in terms of full width at half maximum intensity (FWHM) in units of pixels or wavelength, or in the case of Raman shift, in units of wavenumbers.
Generally, optical resolution is directly related to the slit width. For example, in one 3648-element CCD linear array spectrometer we investigated, a 100 micron slit had an optical resolution of 14.0 pixels FWHM. Decreasing the slit width to 50 microns improved the optical resolution to 7.4 pixels FWHM, but with the trade-off of ~50% as much light throughput. In some conventional spectrometers the slit rejects as much as 75%-95% of the light entering the spectrometer in order to achieve high spectral resolution.
This trade-off is not easy to overcome, requiring less than satisfactory “work-around” strategies and limiting the full measurement potential of the spectrometer. This dynamic becomes particularly acute in low light level spectroscopy applications such as Raman, where 1) Raman-shifted signals are not easily discernible and 2) being able to detect subtle differences in spectra can yield better Raman fingerprinting and more accurate library matching to known spectra. The latter is important, in part, because it underscores that Raman has a role in quantifying mixtures and other complex samples.
How HTVS Technology Overcomes the Resolution-Throughput Tradeoff
A proprietary technology developed by Tornado Spectral Systems (Toronto, Ontario, Canada) has been integrated into a Raman spectrometer to eliminate the trade-off between light throughput and spectral resolution. This high throughput virtual slit (HTVS) technology modifies the shape of the beam in the spectrometer with >90% optical throughput. The input aperture is intentionally and efficiently reformatted into a slit-like shape without violating the étendue principle to provide an optimum balance of throughput and resolution.
Here’s how it works: The spectrometer uses a comparatively large input aperture (for maximum throughput) in combination with a series of specially configured mirrors, lenses and other elements (completely reflective or refractive designs are possible). These components act to compress, reformat and then expand the light beam, with the result of narrowing the input aperture along the dispersion axis while preserving total flux, delivering dramatic performance improvements. The HTVS technology narrows the input beam to the same effect as a traditional slit, but conserves flux at the focal plane by reformatting the beam.
Beam reformatting is not a new concept in spectroscopy. It has been observed that the étendue principle confirms that the conservation of flux on the image plane (e.g., at the slit) is not violated if that image is rearranged to trade horizontal for vertical flux in the image plane. Such image ‘slicers’ have been proposed as early as the 1930s but the implementation of such designs has not been commercially practical. In the new technology, the reformatting takes place in the unfocused ‘pupil’ or ‘Fourier’ space rather than in image space. This approach provides a simpler and more practical implementation to reformat the beam. When the beam in pupil space is focused, the corresponding image is now in the shape of an elongated oval, preserving all of the light while providing the narrower spot image required for high resolution and preserving the imaging f/# (Figure 2).
Unlike fibre bundling, imaging slicing and other techniques designed to overcome trade-offs between throughput and resolution, the HTVS technique relies exclusively on reflective components to achieve the reformatting, avoiding the introduction of any additional glass elements or fibre optics. This prevents any undesired material dispersion or absorption and allows the technology to be applied across all wavelengths from the UV-NIR.
Applying HTVS Technology to Raman Spectroscopy
HTVS technology has great potential to dramatically enhance the performance of Raman spectroscopy systems. As an analytical technique, Raman spectroscopy is an excellent complement to, and in some cases a replacement for, absorption optical spectroscopy, mass spectroscopy and liquid and gas chromatography.
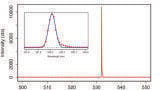
We investigated the effectiveness of a Raman 785 nm spectrometer with integrated HTVS design in measuring the Raman response of samples including paracetamol (acetaminophen) and toluene. Pharmaceuticals and industrial solvents are among many samples where Raman fingerprinting can be especially effective.
To maintain peak optical throughput, the spectrometer was configured with a 1200 line/mm volume phase holographic (VPH) grating blazed at 830 nm, in an optical bench with an uncooled, NIR enhanced back-thinned CCD array detector. A 785 nm diode laser was used for excitation and a 785 nm FC-coupled fibre optic Raman probe and sample holder were used for sample collection (Figure 3). Integration time intervals ranged from 195 milliseconds for toluene to 750 milliseconds for paracetamol.
Results
As shown in Figures 4 and 5, the HTVS spectrometer measured spectral data over a wide Raman shift range beyond 3800 cm-1 with high spectral density, delivering Raman data with more spectral features for better library matching and sample identification. Furthermore, the spectrometer enabled the acquisition of this high quality Raman spectral data at very short integration times.
Typical Raman measurements require seconds to achieve similar signal levels. This measurement speed enables measurements in flowing or process control systems or for samples that change over time. Also, the low integration times required for the HTVS-enabled spectrometer make possible the measurement of multiple samples in the time it takes to get one spectrum from a less sensitive spectrometer. This provides the opportunity for signal averaging to increase signal to noise ratio, thus improving measurement accuracy even further.
Conclusions
HTVS optical technology has been shown to provide a significant increase (a factor of 10x-15x) in optical throughput without any detriment in optical resolution. Consider some of the advantages of spectrometers with HTVS technology versus traditional dispersive spectrometers:
• High sensitivity can be achieved without the need for long integration times, without detector cooling and without the use of high powered excitation sources.
• Shorter integration times allow for faster measurements.
• Lower power excitation sources translate into less photodestruction of the sample.
• High resolution combined with high sensitivity enables measurement of previously undetected spectral features, providing more information for sample characterisation and identification.
Opportunities exist for HTVS-enabled Raman spectroscopy at 532 nm, 785 nm and other Raman excitation wavelengths. For applications where C-OH structural information is important, 532 nm Raman is typical. Such measurements are typical of biological and pharmaceutical sample analysis, where researchers study characteristics of active ingredients, binders, fillers and excipients. Raman with 785 nm laser excitation is designed to minimise the fluorescence signal, making it useful for chemical identification and fingerprinting.
Company Information
Ocean Optics
Tel: +1727-733-2447 (Americas) Tel: +31 26-319-0500 (Europe) Tel: +86 21-6295-6600 (Asia)
Web: www.OceanOptics.com Email: [email protected]
Tornado Spectral Systems
Tel: +1 416.361.3444 http://tornado-spectral.com [email protected]
ILM 51.5 July 2026


-(1).jpg)
.jpg)


.jpg)