GC/MS
Published over 12 years ago. See the latest and most current information on GC/MS.
Shimadzu has released the ChromSquare V2 software for GCxGC(MS) systems. ChromSquare V2 provides easier and more reliable data analysis from GCxGC(MS) analysis, enabling all operations from qualitative to quantitative analysis.
ChromSquare V2 results from cooperative research with a group headed by Professor Luigi Mondello at the University of Messina (Italy). This group implements cutting-edge research in the field of comprehensive 2D chromatography.
GCxGC(MS) analysis is a technique allowing connection in series of two columns with different separation characteristics which enables the separation of target substances even for complicated samples containing hundreds of components. It is applied in fields such as foods, flavourings, environment and chemistry. GCxGC(MS) analysis is also used to analyse natural substances containing many impurities which are impossible to analyse with normal 1D GC or GC-MS methods, and for separating trace components hidden by main components.
Quantities of 2D data obtained from GCxGC(MS) analysis and data from mass spectrometers used as detector are extremely large. They cannot be analysed with a normal workstation and need complicated handling and exporting procedures.
ChromSquare V2 simplifies the GCxGC(MS) analysis process with complicated matrices. It provides a higher operability and data visibility, while enabling easy performing of quantitative analysis. In addition, it runs cooperatively with Shimadzu’s GC-MS software. As a result, this is the optimal product for customers who want to perform analyses with the same operating methods as conventional GC and GC-MS software, and for customers who want to perform both qualitative and quantitative analyses.
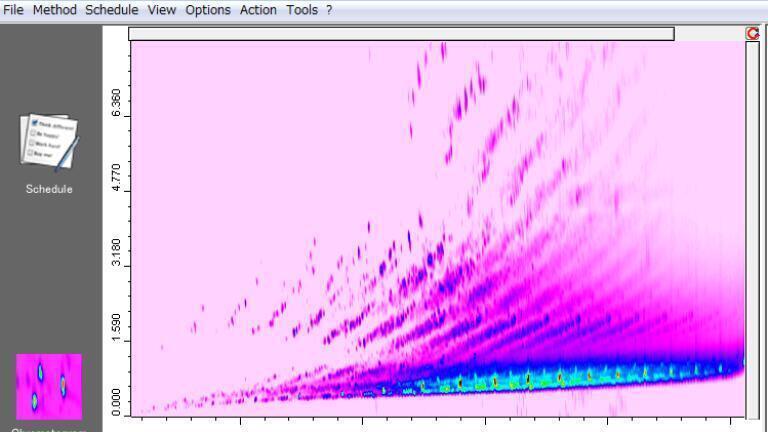
ChromSquare V2 can display a 2D map with boiling point and polarity as the axes, and a raw chromatogram and spectrum that are sources of the map, as well as a table summarising information on peaks detected in the 2D map, all in a single window.
By simply switching between the three panels, the user can perform all necessary operations from qualitative analysis to creation of calibration curves and quantitative analysis.
ILM 51.5 July 2026


-(1).jpg)
.jpg)
-2.jpg)
-Thermo-Fisher-press-rel.jpg)