Chromatography
Published over 5 years ago. See the latest and most current information on Chromatography.
Nowadays, requirements for ideal LC analytical processes are changing significantly, as users demand higher operating efficiencies and more flexibility in the working practice. This also covers the environment where equivalent analytical operations and data analysis can be performed to obtain identical results, even by users who are not located in the laboratory or users unfamiliar with the operating system.
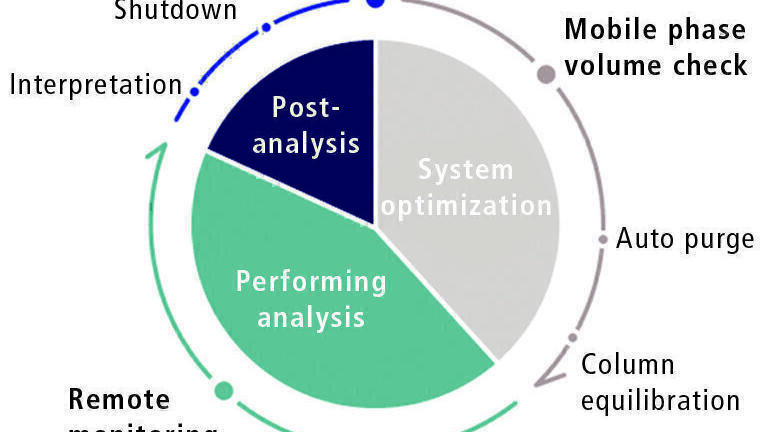
A new concept responding to this need is the Analytical Intelligence approach, integrating more and more automated functions in the analytical LC instruments, thus relieving users from organisational, input and processing tasks. This automates the expertise of expert analysts who avoid common pitfalls to ensure that equally high-quality data can be achieved by anyone. As shown in Figure 1, Analytical Intelligence reduces the risk of system failures by automating system startup, mobile phase volume checks and column equilibration.
One important part of Analytical Intelligence is the FlowPilot, newly integrated into the i-series, enabling fully automated workflow from startup and System Suitability Test (SST) to analysis and ending in shutdown of the system. After an analytical LC-system has started up and the first equilibration of the column is done, it is well known that pressure shock can affect the column performance on the long run by reducing the lifetime and leading to channelling. This results in bad peak shape, e.g. peak-splitting in the corresponding chromatogram.
The normal workflow executed by an LC expert analyst is to gradually increase the flowrate with controlled column temperature to prevent exposing of the column to excessive pressure loads. In real life this means, the FlowPilot can be coupled with the warm-up function and scheduled to user requirements.
When the auto-startup activates the system at the specified date and time, the FlowPilot initiates equilibration of the column by gradually increasing the mobile phase flowrate depending on the column temperature. This means, the system automatically performs the manual operation normally executed by the expert analysts to avoid column damage and to finish preparation of the LC-system for further analysis.
Combination with an automated System Suitability Test (SST) after the warm-up phase is used to verify that the chromatography system is adequate for the intended analysis. The SST can include specific parameters (e.g. number of theoretical plates, resolution, tailing factor or capacity factor k). Depending on the criteria previously selected, a ‘pass’ or ‘fail’ result will trigger specific actions based on user preferences (e.g. repeat, run or abort next samples). The self-operating report function of measurements and shutdown at the end, turning off the instrument and switching to power-saving mode after completion of all analytical operations, accomplish the fully automated workflow (Figure 2).
Figure 2. Workflow diagram showing the fully automated operation of LC analysis (shutdown → start-up → SST → analysis → report results → shutdown).
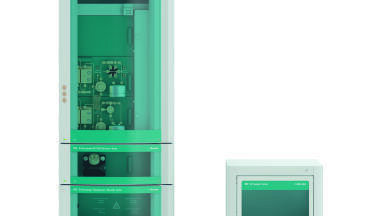
Mobile Phase levels must be managed, because running out of solvents during analysis not only causes the analysis to fail but can also damage the expensive analytical columns. A specific monitor can measure the amount of remaining mobile phase in real-time; it operates in combination with a dedicated software to check solvent level.
The MPM-40 Mobile Phase Monitor unit is configured with a weight sensor and controller for calculating solvent level based on the actual mobile phase weight. Via a LAN connection, the MPM-40 transfers data of the current quantity inside the mobile phase bottle in real-time to a computer or smartphone.
The remaining level is displayed graphically by the dedicated MPMChecker software (Figure 3). When the mobile phase quantity is too low, a warning (orange) or error (red) signal notifies the user. The MPMChecker also stops the LC-system as soon as specified criteria are met.
Figure 3. Mobile Phase Monitor (MPM-40) and MPMChecker.
The development of analytical methods for new compounds mainly involves four steps:
1. Simulation which predicts retention behaviour based on information on the structural and other properties of target compounds being analysed.
2. Method scouting: columns and mobile phase candidates are scouted comprehensively through trial analyses using different combinations of various columns and mobile phases.
3. Method optimisation: here, the columns and mobile phases giving the best results during method scouting and optimising of various parameters are selected.
4. The last step is method validation to evaluate robustness of the analytical methods.
A high pressure HPLC-system was used with pressure tolerance up to 130 MPa equipped with 2 pumps, both including a quaternary LPGE valve, and the column oven includes a 7-port, 6-position switching valve. The system can search comprehensively for analytical conditions by trying up to 72 combinations of eight types of mobile phases and six types of columns automatically.
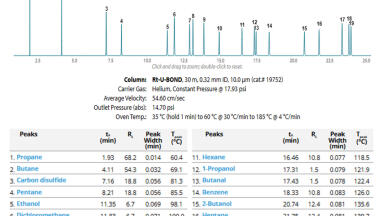
An analytical method for the analysis of sulpha drugs should be developed. This medication is used in synthetic antibacterial agents, anticancer agents and other pharmaceuticals. The initial conditions considered for the sulpha drugs are shown in Figure 4.
In this case, a total of four types of mobile phases were considered by combining either two types of (sodium) phosphate buffer solutions with different pH values as solvent A and acetonitrile or methanol as solvent B. Six types of column were considered, including three Shim-pack XR series columns. These four mobile phases and six columns were used to test a total of 24 analytical condition combinations.
Figure 4. Scouting analytical conditions for simultaneous analysis of sulpha drugs.
Method Scouting Solution software automating all analysis processes
The main window displayed in Method Scouting Solution software is shown in Figure 5, with various parameters for mobile phases, columns, sample information, gradient conditions etc. The corresponding icons can be clicked to change the respective parameters easily. This makes the creation of the batch for the scouting runs very intuitive and simple.
The following steps described in Figure 5 should be done consecutively:
1. Selection of the columns and mobile phases preregistered in the database
2. Specification of the gradient conditions
3. Entering of sample information and other parameters
4. Clicking the [Create Batch] button.
By using the previously described fully automated workflow for starting the HPLC, the Method Scouting Solution software is also able to automate all analysis processes, from preparing the system for analysis (startup) to shutting down the system after the analysis is finished (shutdown). Consequently, the software can significantly reduce the amount of time, errors and efforts required to specify conditions and execute analyses for method scouting.
Figure 5. Method scouting solution main window.
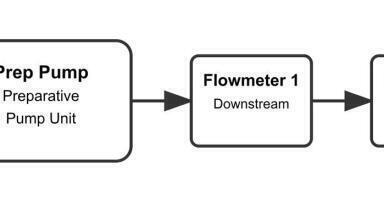
For preparation purposes, the system includes an automatic mobile phase blending function, mixing combinations of up to four types of solvents for each mobile phase sent to two delivery pumps (Figure 6). Using this tool, the mobile phase pH level, salt concentration, quantity of acid added etc. can be adjusted automatically, reducing the number of mobile phases to be prepared before starting an analysis. This saves preparation time, avoids the risk of operating errors and eliminates the need to prepare extra mobile phase.
Figure 6. Solvent blending.
In addition to the existing linear gradient mode, the Method Scouting Solution also supports multilinear, stepwise patterns for gradient time and isocratic gradient modes. After selecting the gradient mode and entering in time the organic solvent concentration at respective points, the software creates the gradient profile automatically. In this example of sulpha drug analysis, the linear gradient mode was used, as indicated for step 2 in Figure 5.
After selecting the mobile phases and columns and specifying the gradient conditions, sample information and other settings, clicking the [Create Batch] button and checking the batch creation preview window, clicking the [Create Batch & Run] button starts the scouting process.
Determining the optimal mobile phase and column combination based on the huge amounts of analytical results generated by method scouting is challenging. However, by using the multi-data report and data browser functionality included in LabSolutions DB/CS, the ideal conditions can be set quickly: not only based on the evaluation values shown in the multi-data report, but also by displaying a summary of the peak elution status for each chromatogram.
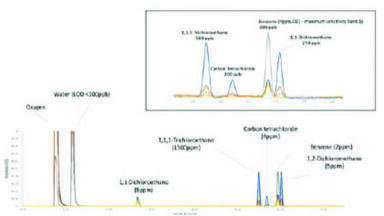
Furthermore, the data browser can also display only chromatograms for a candidate’s perfect analytical set-up, based on evaluation value results using the multi-data report. As a result, optimal conditions for simultaneous analysis of nine sulpha drugs were established successfully based on the multi-data report and data browser functionality. Details are shown in Figure 7.
Figure 7. Optimal combination of column and mobile phases for simultaneous analysis of sulpha drugs determined by method scouting and corresponding chromatogram.
After determining the optimal combination of mobile phases and column, method scouting can also involve optimising of gradient conditions to improve resolution or increase speed.
This section describes an example of using the mobile phases and column determined before to optimise gradient conditions. Multiple gradient conditions can be created easily by selecting ‘custom’ as the gradient mode in the main Method Scouting Solution window. In Figure 8, initial, final and washing concentrations are defined, and time program settings can be specified. Furthermore, multiple patterns can be selected for the initial and final concentration settings. In this example, initial concentration was set to 5, 10 and 15 % and final concentration was set to 29, 32, 35 and 38 %. Using all these patterns for analysis results in 12 gradient condition configurations.
Figure 8. Gradient pattern condition settings.
Optimising the initial and final gradient concentrations leads to improved resolutions between sulfadimidine and sulfamethoxypyridazine, and between sulfadimethoxine and sulfaquinoxaline sodium. The resulting optimal analytical conditions and chromatogram are shown in Figure 9.
Using the scouting system described, it is possible to determine optimal analytical conditions easily and quickly. Moreover, it is easy to view a summary of evaluation values and chromatograms for the analytical results obtained. The system can also be used for determination of analytical conditions for new compounds, checking the robustness of developed analytical conditions, testing the differences between various analytical columns, and other applications, while significantly reducing the time and effort required for analytical operation. In addition to the high pressure HPLC-system, the dedicated Method Scouting Solution software is also compatible with modular quaternary-systems (low-pressure gradient systems) or integrated LC-systems. This means, existing systems can be expanded easily to method scouting systems. The Analytical Intelligence approach embracing the automated functions fully benefits lab productivity and profitability.
• C190-E262, Technical Report, January 2021, Incorporating Analytical Intelligence into the Integrated i-Series - New Analytical Workflow Automation
• C190-E211, Technical Report, February 2017, Ultra Fast Method Scouting (2)
- Maximizing the Efficiency of Method Development
ILM 51.5 July 2026


.jpg)
.jpg)


-(1).jpg)