Chromatography
Published over 13 years ago. See the latest and most current information on Chromatography.
The use of organic solvents in liquid chromatography is common; indeed trying to perform a separation with just an aqueous mobile phase in most laboratories is one that is not readily considered. Here we will discuss how a greener approach to separation science can be employed by raising the mobile phase temperature and decreasing or even eliminating the need for an organic solvent. Other advantages associated with the use of temperature will also be discussed, in particular the selectivity changes that can occur as the temperature is varied.
The exploitation of temperature as a key experimental parameter does require an understanding of what the appropriate operating conditions should be and data will be presented to look at the effect that temperature has on the operating pressure as well as the solubility of the mobile phase.
There are, however, perceived disadvantages of this approach, specifically the thermal stability of the analyte and column will be investigated and an approach to minimise these effects will be discussed.
Experimental Parameters to be Considered
One of the first considerations in going to green HPLC, that is chromatography that does not use organic solvents, is to determine what experimental conditions are required to allow the use of a purely aqueous mobile phase. Clearly this will be dependent on the analyte being investigated, but it will also depend on the physical properties of the mobile phase, in this case water. To fully understand the advantage that using an aqueous mobile phase at elevated temperatures has, it is important to be aware of the physical changes that occur with water at elevated temperatures, both in terms of the viscosity and hence operating pressure, but also in terms of the solubility of the mobile phase, and also the chemical changes with an increase in the static permittivity resulting in organic compounds becoming soluble in water at elevated temperatures, thus behaving more like an organic solvent.
Viscosity – Pressure – Temperature Variation
The variation of temperature and viscosity for water has been well documented, and there are many models [1-5] which have been developed to account for the variation in the viscosity over a specified temperature range. One of the simplest models was developed by Andrade [2], and is given in Equation 1.
Equation 1. Variation of viscosity with temperature
where:
ηT – is the viscosity at a temperature T in Kelvin.
b – is a constant which is dependent on the fluid.
T – is the thermodynamic temperature in Kelvin.
η0 – is the viscosity at 0 Kelvin, this is clearly a theoretical value.
It can be seen that as the temperature is increased the viscosity of the mobile phase drops, which means that the flow rate can be increased, since this results in a reduction in the pressure drop across the column, clearly this is an advantage to most separation scientists as it allows for faster analysis [6].
Variation of optimal flow rate with temperature
An examination of the van Deemeter [7] equation reveals that increasing the rate of diffusion will affect both the ‘B’ and ‘C’ terms. The ‘B’ term, the rate of longitudinal diffusion, will increase as the temperature is increased. As a consequence the optimal flow rate will also increase.
Increasing the diffusion rate will also have an effect on the ‘C’ term, which relates to the radial dispersion of the analyte, which will improve the mass transfer, thus lowering the effect that the ‘C’ term has on the dispersion process. See Table 1.
Where;
λ – constant relating to particle packing,
dp – particle diameter,
γ – mobile phase visocosty,
Dm, Ds – diffusion coefficients in mobile phase and stationary phase for analyte,
Φ – phase ratio
ω - constant, df – film thickness, k - retention factor for analyte,
c’,c’’ – constants
u – Linear velocity of mobile phase
The key temperature dependent parameters in this equation are the Dm and Ds terms which relate to the diffusion of the solute in the mobile and stationary phases, respectively.
Increasing the temperature will not only affect the viscosity, but it will also affect the diffusion of the analytes within the mobile phase, as given by the van Deemter equation in Table 1, which will in turn affect the band dispersion process occurring within the column. The rate of diffusion of a molecule can be explained by an Arrhenius type expression as given in Equation 2 [8].
Equation 2. Variation of diffusion with temperature
Where Dm, Ds – the diffusion rates in the mobile and stationary phases, α, β - constants, Ea1, Ea2 - activation energies, R – universal gas constant, and T - temperature in Kelvin.
It can be seen from this that the diffusion rate will increase with the temperature for both of these parameters. It is a reasonable assumption that the rate of diffusion on the surface is related to the rate of diffusion of the molecule in the bulk mobile phase [9]. If this is the case then it becomes possible to determine what the optimal flow rate is to obtain the minimum peak dispersion.
Classically the optimum flow rate is given by the differential of the van Deemter equation;
Resulting in;
Equation 3. Optimal flow rate equation
It should be noted that the assumption here is that the ‘A’ term is flow independent, which is generally agreed not to be the case [10-13] for the more developed models of dispersion within a packed bed. However this simple treatment will allow for an understanding of how temperature affects the optimal flow rate and also how it affects the band dispersion process.
Equation 4. Variation of the optimal flow rate as a function of temperature
Plotting vopt as a function of temperature will show the dependency of the optimal flow rate (where the minimum dispersion is seen) with the operating temperature. Figure 1 shows this plot and Figure 2 shows, schematically, the effect of changing the temperature on the optimal flow using this model. It can be seen from both figures that increasing the temperature results in the optimal flow rate increasing, and Figure 2 demonstrates that by increasing the flow rate the ‘C’ term dependency reduces. As a result the separation scientist is able to operate at flow rates higher than the optimal flow without a substantial loss in column performance.
Column Stability
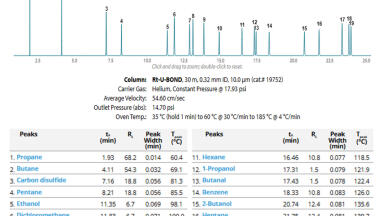
An issue that needs to be discussed is the stability of silica based columns at extreme temperatures. Certainly most bonded silica is not stable [14, 15] and peak deterioration and retention time shift can be expected when running at temperatures above 60°C as demonstrated by Figure 3.
However, there are mechanisms by which silica-based stationary phases can be modified to increase thermal stability:
• use of a more stable ligand binding [16]
• use of hybrid phases [17]
• encapsulation of the silica [18]
Other phases are available which will also offer thermal stability when compared to traditional silica phases, these include, alumina [19,20], zirconia [21,22] and finally porous graphitic carbon [23-25]. The most interesting of these phases is the porous graphitic carbon phase [23] which is very stable to extremes of operating temperature and pH, with part of the manufacturing involving heating the material to temperatures in excess of 2000°C (although in an inert environment).
Figure 3b shows how the choice of a suitable stationary phase can be beneficial. In this example, the performance of the column was measured at the start of a high temperature investigation and at the end, after 6 weeks, where the column was operated at up to 200°C [26]. It can be seen that the two test chromatograms, taken at the start and the end of the six week test period, are virtually identical, with the efficiency of the last peak decreasing by less than 10%.
Compound Stability
Compound stability has often been proposed as a reason not to use elevated temperatures in liquid chromatography. Indeed, there are many examples of compounds which are not stable at elevated temperatures [27-30] and the use of elevated temperatures over long periods of time is clearly not advantageous for compound stability. However, this statement needs to be investigated in more detail, since many compounds that are thermally labile do actually require some time to decompose and also the environment that they are in will also affect the rate of decomposition.
Figure 4 demonstrates that it is a combination of time and temperature which cause compounds to thermally degrade. Thus in the first chromatogram the temperature used is lower than in the second, but the compound takes longer to elute which results in more degradation than compared to the elevated temperatures used in the second separation. Thus, by careful manipulation of the temperature it is possible to overcome some of the issues associated with thermal instability.
Other Considerations
There are other practical considerations when dealing with elevated temperatures, in particular most detectors will be affected by the elevated temperatures of the mobile phase. It is therefore important to ensure that the solvent temperature when it reaches the detector is compatible with that detector. This invariably means that the temperature needs to be reduced to room temperature to ensure that the detector performs optimally [31-33]. However, as reported by Pereira [26], raising the temperature of the mobile phase can be used to improve the sensitivity of the detector system, in this case a mass spectrometer.
Another consideration when running at temperatures above 100°C with an aqueous mobile phase, is the phase transition that can occur within the column. Bubbling within the column can cause bed movement which will deteriorate the separation unless suitable precautions are taken. To avoid a phase transition occurring in the column, it is necessary to apply a pressure at the exit of the column; this can be achieved using a linear restrictor which has an associated pressure drop of 40 bars [34] which ensures that even at 200°C, the eluant will remain in a liquid state.
Isothermal Studies
One of the interesting aspects of using temperature as an active variable in method development is that the selectivity of the chromatographic separation can change as the temperature changes, which is shown in Figure 5. In the example given here the mobile phase is primarily water, with 0.1% formic acid added. This figure is based on the van’t Hoff equation (Equation 5) which relates the retention time of a component to the temperature. There is an assumption that the retention mechanism is consistent at different temperatures to obtain linearity, however non-linearity would indicate a change in the retention mechanism.
Equation 5. Variatiation of retention factor to temperature
One of the advantages of just using a single mobile phase component, and making the chromatography greener is that the method development can become a single variable, temperature. Since it is relatively easy to alter the temperature this becomes an ideal scenario for separation scientists. The example shown in Figure 6 demonstrates that organic solvents can be completely replaced to ensure green chromatography, simply by raising the temperature. In this example a comparable separation of 6 compounds is achieved, with a slight improvement in peak shape when using a green mobile phase.
Gradient Studies
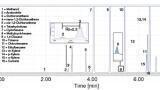
As with multi-solvent systems, an optimal time based separation is obtained when an elution strength gradient is used [33]. Using only water as the mobile phase, temperature programming can be used instead of solvent programming to alter the elution strength of the mobile phase. Figure 7 demonstrates how a temperature gradient can be applied to the successful separation of a series of purines and pyrimidines on a porous graphitic carbon column and only using water as the mobile phase.
There are many other examples of where green chromatography has been successfully applied [34-38] either on a porous graphitic carbon column or on one of the columns mentioned previously, either isothermally or utilising a thermal gradient to ensure optimisation of the analysis time. These examples range from pharmaceutical analysis to petrochemical samples and demonstrate the wide applicability of the technique.
Conclusion
We have shown in this article that performing separations at elevated temperatures can be beneficial. In an environment where the use of organic solvents is increasing within separation science, the use of water coupled to temperature will improve the green credentials of this particular science. To progress this area of chromatography further, a wider range of thermally stable columns and a greater awareness of the available column oven technology needs to be developed. The capability to perform rapid temperature gradients will ensure that this technology can become mainstream and does not become a niche topic, with little industrial applicability but with a high academic following due to the peculiarity of using such relatively extreme conditions.
References
1. J.S. Medina, R. Prosmiti, P. Villarreal, G. Delgado-Barrio, G. Winter, B. González, J.V. Alemán, C. Collado, Chem. Phys., 388 (2011) 9-18
2. D.A. Andrade, Viscosity and Plasticity, W. Heffner & Sons, Cambridge, 1947.
3. T. Teutenberg, S. Wiese, P. Wagner, J. Gmehling, J. Chrom. A, 1216 (2009) 8470-8479
4. L. Dagdug, L.S. García-Colín, Physica A: Statistical Mechanics and its Applications, 250 (1998) 133-141
5. George S. Fanourgakis, J. S. Medina , and R. Prosmiti J. Phys. Chem. A, 2012, 116 (10), 2564–2570
6. S. Heinisch, G. Desmet, D. Clicq, J-L. Rocca, J. Chrom. A, 1203 (2008) 124–136
7. J.J. van Deemter, F.J. Zuiderweg, A. Klinkenberg, Chem. Eng. Sci., 1956, 5, 271
8. D. Brogioli and A. Vailati, Phys. Rev. E 63, 012105/1-4 (2001)
9. F. Gritti, Chrom. Today, 5(2) (2012) 4-11
10. J. H. Knox, J. Chrom. A, 831, 1, (1999), 3-15
11. K. Miyabe, G. Guiochon, J. Chrom. A, 961, 1, (2002), 23-33
12. F. Gritti, I. Leonardis, J. Abia, G. Guiochon, J. Chrom. A, 1217, 24 (2010) 3819-3843
13. J. Haun, K. Oeste, T. Teutenberg, T.C. Schmidt, J. Chrom A, 1263 (2012) 99– 107
14. J.C. Giddings, J. Chrom. A, 3 (1960) 443-453
15. H.A. Claessens, M.A. van Straten, J.J. Kirkland, J. Chrom. A, 728, 1–2 (1996) 259-270
16. H.A. Claessens, M.A. van Straten, J. Chrom. A, 1060, 1–2 (2004) 23-41
17. A.M. Edge, I.D. Wilson, S. Shillingford, Chromatographia 66 (2007) 831
18. M. Koel, M. R. Kaliurand, M. Koel, Green Analytical Chemistry pub RSC (2010) chapter5
19. J.J. Pesek, M.T. Matyska, J. Chrom. A, 952, 1–2, (2002) 1-11
20. R, Trones, A. Tangen, W. Lund, T. Greibrokk, J. Chrom. A, 835, 1–2 (1999) 105-112
21. Y. Xiang, B. Yan, B. Yue, C.V. McNeff, P.W. Carr, M.L. Lee, J. Chrom. A, 983, 1–2 (2003) 83-89
22. R.E. Paproski, C. Liang, C.A. Lucy, J. Chrom. A, 1218, 44 (2011) 7948-7955
23. J.H. Knox, B. Kaur, G.R. Millward, J. Chrom. A, 352, 21 (1986) 3-25
24. Karen Gaudin, Pascal Millet, Fawaz Fawaz, Piero Olliaro, Nicholas J. White, Céline Cassus-Coussère, Ulrich Agbahoungha, Jean-Pierre Dubost, J. Chrom. A, 1217, 1 (2010) 75-81
25. C. West, E. Lesellier, J. Chrom. A, 1087, 1–2 (2005) 64-76
26. L. Pereira, S. Aspey, H. Ritchie, J Sep Sci. 8 (2007) 1115-24.
27. J. Volden, Y. Thomassen, T. Greibrokk, S. Thorud, P. Molander, Analytica Chimica Acta, 530, 2 (2005) 263-271
28. V.V. Korshak, V.A. Khomutov, Yu.Ye. Doroshenko, Polymer Science U.S.S.R., 18, 3 (1976) 597-603
29. J.D. Thompson, P.W. Carr, Anal. Chem., 2002, 74 (5), 1017–1023
30. S. Heinisch, J-L. Rocca, J. Chrom. A, 1216, 4 (2009) 642-658
31. D. Guillarme, S. Heinisch, J.Y. Gauvrit, P. Lanteri, J.L. Rocca, J. Chrom. A, 1078, 1–2 (2005) 22-27
32. J.S.B. de Vlieger, M.J.N. Giezen, D. Falck, C. Tump, F. van Heuveln, M. Giera, J. Kool, H. Lingeman, J. Wieling, M. Honing, H. Irth, Wilfried M.A. Niessen, Analytica Chimica Acta, 698, 1–2, (2011) 69-76
33. S. Wiese, T. Teutenberg, T. C. Schmidt, J. Chrom. A, 1222 (2012) 71– 80
34. A.M. Edge, S. Shillingford, C. Smith, R. Payne, I.D. Wilson J.Chromatogr. A 1132, (2006) 206
35. A. Hazotte, D. Libong, P. Chaminade, J. Chrom. A, 1140, 1–2 (2007) 131-139
36. T. Greibrokk, T. Andersen J. Chromatogr. A 1000 (2003) 743
37. H. Gika, G. Theodoridis, J. Extance, A.M. Edge, I.D. Wilson J. Chromatogr. B 871 (2008) 279
38.T. Teutenberg, Anal. Chim. Acta 643 (2009) 1
ILM 51.5 July 2026


.jpg)


-(1).jpg)