
Mass spectrometry & spectroscopy
Published over 12 years ago. See the latest and most current information on Mass spectrometry & spectroscopy.
Many processes in fine chemicals manufacture rely on acid or base catalysis. Traditional homogeneous acids and bases, such as sulphuric acid and caustic solutions lead to large amounts of contaminated waste on separation from reaction mixtures. The use of solid catalysts would eliminate this waste, but offer challenges in terms of providing adequate catalytic activity.
Crucial to the development of sufficiently active solid acids and bases are catalyst characterisation techniques which can help us understand structure/function relationships. One of the accepted techniques for characterising surface acidity and surface basicity is adsorption calorimetry, using probe compounds to study the concentration and strength of active sites. For solid acids a basic probe such as NH3 is used, and for solid bases acidic probe such as SO2 or CO2 are used. The probe is progressively introduced to the catalyst until the active sites are saturated. The molar enthalpy of adsorption of the probe (∆Hads°) is plotted against the amount of probe adsorbed on the catalyst. It is assumed that the probe adsorbs stoichiometrically on active sites, and that ∆Hads° is an indicator of the strength of the acid or base sites. The resulting profile can be interpreted, broadly at least, as an active site strength distribution profile.
The most widely used approach is to introduce the probe gas from a gas burette, allowing the system to reach equilibrium at each addition, and progressively increasing the pressure of the gas. The sample is held in the calorimeter cell which is inside the gas-tight system, at a temperature high enough to minimise adsorption on sites other than active sites. Difficulties with this method are that 1) experiments are long and complex, and, 2) it is never possible to fully discriminate between adsorption on weak sites and adsorption on active sites.
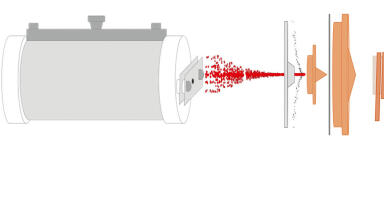
We have developed a different approach, in which the catalyst sample (< 50 mg) is held on a frit in a flow-through differential calorimeter and the probe gas is introduced as a series of pulses injected into a steady flow of carrier gas, normally nitrogen. The pulses are delivered from a gas sampling valve upstream of the calorimeter under automatic control. The pulse size is controlled by the sampling loop, and by the make-up of the pulse gas (which is typically 1% probe gas in the inert carrier). Again, the calorimeter is held at a temperature to minimise weak adsorption on non-active sites in the catalyst. The outflow from the calorimeter cell is sampled by a low-flow capillary interface linked to a Hiden HPR-20 QIC Quadrupole Mass Spectrometer.
Once calibrated with the probe gas, the mass spectrometer signal (using an m/z unique to the probe gas) provides a measure of the amount breaking through the sample from each pulse and therefore allows the amount adsorbed by the sample to be calculated. The data is essentially equivalent to that available from the equilibrium system described above and can be presented in the same way, as a profile of ∆Hads° against the amount adsorbed. The advantages of the flow technique are that it is inherently simpler and quicker, and, most importantly, it is only sensitive to probe gas that adsorbs irreversibly (strongly) on the sample. Probe that adsorbs reversibly desorbs as soon as the pulse has passed over the sample and the gas reverts to the carrier stream. In other words, it overcomes the difficulty of discriminating between weakly and strongly adsorbed probe gas.
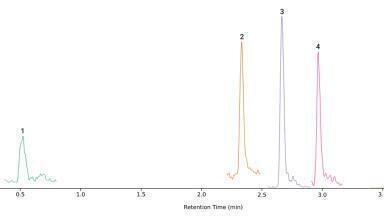
The system is shown in Figure 1. Example data from an experiment in which NH3 is introduced to a solid acid catalyst is shown in Figure 2.
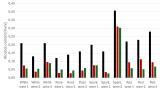
The usefulness of this data in characterising solid acid catalysts is illustrated in Figure 3, where profiles of -∆Hads°(NH3) vs amount of NH3 adsorbed are shown for a series of polymer-supported sulphonic acid catalysts. The objective of this study was to identify the most suitable of these catalysts for each of two liquid phase, acid-catalysed, reactions, and to explain the results in terms of catalyst structures.
Figure 3: -∆Hads° (NH3) vs. amount adsorbed for catalysts studied, at 120 oC.
Five catalysts were studied. Amberlyst 15 is a macroporous polystyrene sulphonic acid resin. Amberlyst 35 is similar except that it has been sulphonated at a level above the stoichiometric level of one acid group per styrene residue. D5081 and D5082 are polystyrene sulphonic acid resins that incorporate additional cross-linking and are described as ‘hypercrosslinked’, resulting in very high surface areas (> 500 m2 g-1 compared to ca 40 m2g-1 for Amberlyst 15/35) and, it is assumed, good accessibility of acid sites to reactant molecules.
Nafion is a fluorinated polymer-supported sulphonic acid, and the SAC-13 derivative is a composite with silica gel, designed to increase surface area and accessibility of acid sites.
The data in Figure 3 shows the relative concentrations of acid sites on the five resins (it is assumed that only those sites on which -∆Hads° is greater than 80 kJ mol-1 are significantly acidic). The average values of -∆Hads° above this value for each catalyst are indicators of acid strength.
The two reactions used were (a) the esterification of oleic acid with methanol and (b) the rearrangement of α-pinene to camphene. The former is a relatively facile reaction, and the latter requires relatively strong acid sites for catalysis.
a) CH3(CH2)7CH=CH(CH2)7COOH + CH3OH CH3(CH2)7CH=CH(CH2)7COOCH3 + H2O
b)
α-pinene camphene
Initial turnover frequencies (TOF) for the two reactions appear in the Table. These TOF values can be taken as measures of the activities of the individual acid sites. The important observation from this data is that, for the more demanding α-pinene reaction, the TOFs show a direct dependence on the strengths of the acid sites (from Figure 3) whereas for the facile oleic acid esterification reaction there is only a weak dependence of activity on acid strength (the most active catalyst is Nafion, but the order displayed by the others does not correspond to the order of acid strengths).
Catalyst TOF (α-pinene) / h-1 TOF (oleic acid) / h-1
D5081 18.4 17.1
D5082 19.1 9.7
Amberlyst 15 23.1 0.97
Amberlyst 35 24.2 0.34
Nafion SAC-13 257 22.2
Table 1: Catalytic activities, as initial turnover frequencies, in the two test reactions.
Reaction conditions: 10 g α-pinene, 0.20 g catalyst, 120 oC
4 g oleic acid, 20 g methanol, 0.20 g catalyst, 65 oC.
The conclusion from this is that the key factor in controlling the kinetics of the more demanding, α-pinene, reaction is catalyst acid strength. In contrast the kinetics of oleic acid esterification are largely controlled by acid site accessibility, and the hypercrosslinked resins, while exhibiting relatively weak acid sites, show high activity because of their expanded structure and highly accessible acid sites.
References:
E. Andrijanto, E. A. Dawson, D. R. Brown (2012) “Hypercrosslinked polystyrene sulphonic acid catalysts for the esterification of free fatty acids in biodiesel synthesis” Applied Catalysis B: Environmental 115-116,
Pages 261-268
Follow the link to the product catalogue on our website for further information:
http://www.hidenanalytical.com/en/products/for-gas-analysis/hpr-20-qic-r-d
Lab Asia 33.4 - August 2026


-(1).jpg)

.jpg)


-(1).jpg)
