-

-
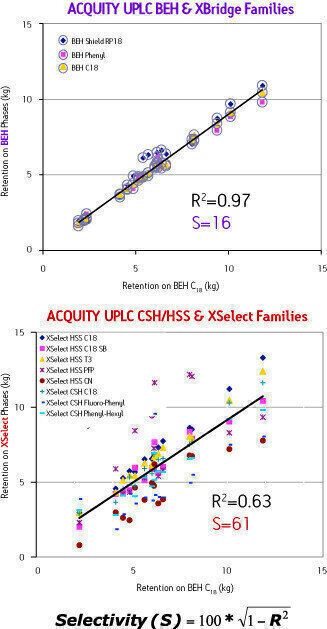 Figure 1
 -
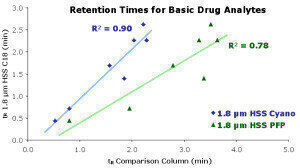 Figure 2
Chromatography
Successful Separations Start with Selectivity
Nov 09 2011
How many times have you struggled with separating a co-eluting critical pair of peaks or separating an interfering matrix peak from the compound you wish to integrate and quantify? When this situation arose, chances are good that you tried multiple columns under a variety of conditions. Eventually you were successful. Thinking back to those difficult separations, or even those that you are working on today, how were the columns chosen that worked? Or why did you choose them?
The best chance of success for chromatographic method development depends on the ability to maximize the selectivity between truly different LC columns in order to minimize the additional optimization required for that method. In order to take full advantage of this column “selectivity space” you need an understanding of how selectivity can be mapped so that you can make an informed column choice. Simply looking at a series of chromatograms generated from your column bank is one way of picking the “best” one. However, it can be confusing for complex mixtures, and does it point you in the right direction?
A better approach for assessing selectivity differences between columns for a given application involves a simple comparison of retention times. The retention times for each compound of a test mix on one column are used as y-axis data points. The retention factors for the same compounds on the comparison column are used as the x-axis data points. A linear regression through the x-y data gives the coefficient of determination, R2, which can be used to compare selectivity differences between columns for a given method and set of analytes. Larger deviations from R2 = 1 indicate greater differences in selectivity. This is shown for the current data set in Figure 1, revealing R2 values of 0.90 and 0.78 for the XSelect HSS Cyano and XSelect HSS PFP HPLC columns, respectively.
Figure 1
In the example shown for Figure 1, a single linear regression was performed using the retention date for a single column comparison. A more detailed approach is to calculate S-values for the individual column pairs for an entire family or bank of columns to determine the maximum selectivity space. This way, similar column choices can be traded for more effective alternatives. Figure 2 shows retention data plotted for the columns that make up the XBridge™ column family of reversed-phase sorbents and the new XSelect™ column family against the selectivity offered by XBridge C18. The more scatter around the regression line, the larger the selectivity difference. Under these mobile-phase conditions, the S-value provided by the XSelect columns is almost 4 times greater than that obtained for the XBridge columns (S=16).
Figure 2
By plotting the selectivity difference with a known set of analytes you can map the selectivity space for an entire family of columns, making your column selection more effective.


Digital Edition
Lab Asia 31.2 April 2024
April 2024
In This Edition Chromatography Articles - Approaches to troubleshooting an SPE method for the analysis of oligonucleotides (pt i) - High-precision liquid flow processes demand full fluidic c...
View all digital editions


.jpg)


Events
May 14 2024 Oklahoma City, OK, USA
May 15 2024 Birmingham, UK
May 21 2024 Lagos, Nigeria
May 22 2024 Basel, Switzerland
Scientific Laboratory Show & Conference 2024
May 22 2024 Nottingham, UK