Microscopy & microtechniques
Published over 16 years ago. See the latest and most current information on Microscopy & microtechniques.
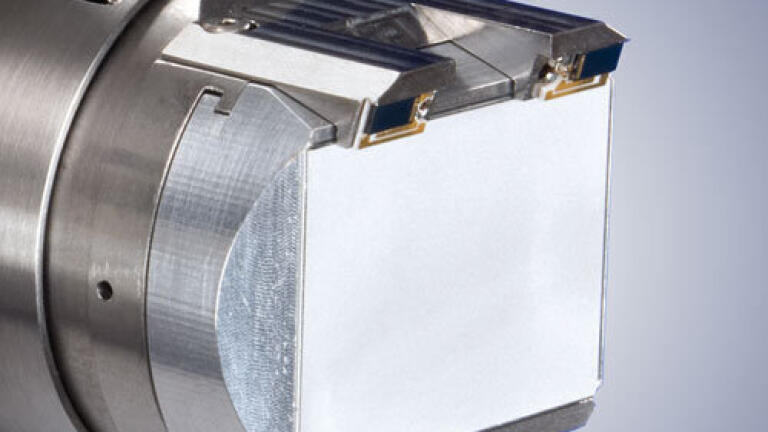
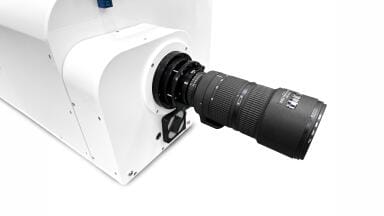
Bruker’s high performance EBSD detector e¯Flash 1000 is now optionally available with a set of forescattered electron (FSE) and backscattered electron (BSE) detectors – e¯Flash 1000+. This further increases the versatility of the detector and provides valuable additional information for meaningful and efficient EBSD analysis.
The set of two BSE detectors is mounted above the screen of the EBSD detector. The three FSE detectors are below the screen. This position of the detectors does not affect the performance or user-friendliness of the e–Flash 1000, the screen remains user replaceable.
All electronics required for the operation of the FSE/BSE detectors are already included in the e–Flash 1000+ detector encasement. Apart from the convenience this also ensures that signal loss is minimized as the preamplifiers are close to the detectors.
If the EBSD detector is fully inserted the standard SEM SE and BSE detection systems tend to produce noisy images of low quality. Bruker’s BSE detectors are positioned optimally to acquire the BSE signal from samples with a high tilt angle, as is the case for EBSD measurements. This includes the location above the screen and the inclination towards the sample, both of which ensure optimum signal strength. Also, the EDS detector can pass between the BSE detectors, to provide best possible conditions for simultaneous EDS and EBSD acquisition.
The BSE detectors produce a density-dependent signal, similar to that by conventional SEM BSE detectors. This signal can be used individually or mixed with that from the FSE detectors.
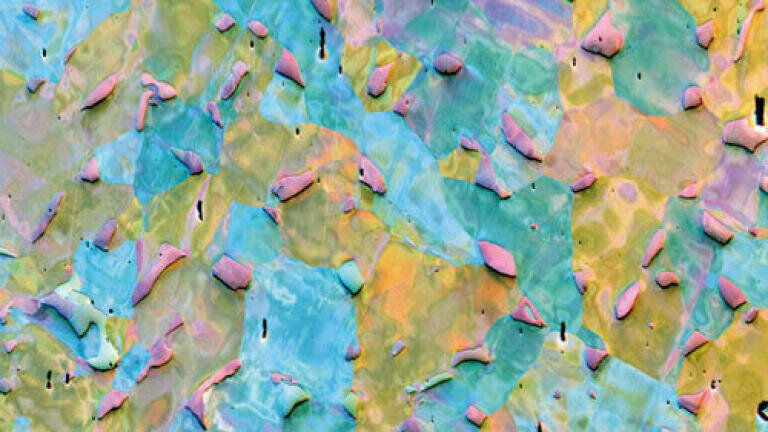
Each of the three FSE detectors below the EBSD screen captures a part of the diffraction signal. As this is anisotropic and dependent on crystallite orientation, it is improbable that all three of the FSE detectors will register the same signal brightness for adjacent grains.
Color coding and mixing the individual detector signals produces colorful images of the grain structure. This feature is unique to Bruker’s FSE detectors. The user even has the choice to define palettes for optimum sample representation.
These images prove very helpful for subsequent EBSD analysis. The clarity of the image indicates the quality of sample preparation. Moreover, these images can be used to judge the microstructure of the sample and to determine areas most interesting or representative for the actual EBSD analysis, as well as for an extremely fast analysis of heterogeneities in the microstructure.
Lab Asia 33.4 - August 2026


-(1).jpg)


-(1).jpg)
