Chromatography
Laboratories that buy synthetic peptides rather than synthesise them rely heavily on the purity figure provided by the supplier’s certificate of analysis (CoA). A claim such as ‘≥98 per cent by reversed-phase high-performance liquid chromatography (RP-HPLC)’ is easy to treat as a pass/fail gate.
In practice that number is the product of several method choices: detection wavelength, column chemistry, gradient shape, integration rules and how co-eluting impurities behave under those conditions. This article explains what a RP-HPLC purity claim does and does not establish for solid-phase peptide synthesis (SPPS) products and why identity confirmation by mass spectrometry should accompany it.
The discussion is aimed at buyers and quality staff in research and analytical laboratories. It does not recommend specific commercial products, dosing, or any human use of peptides.
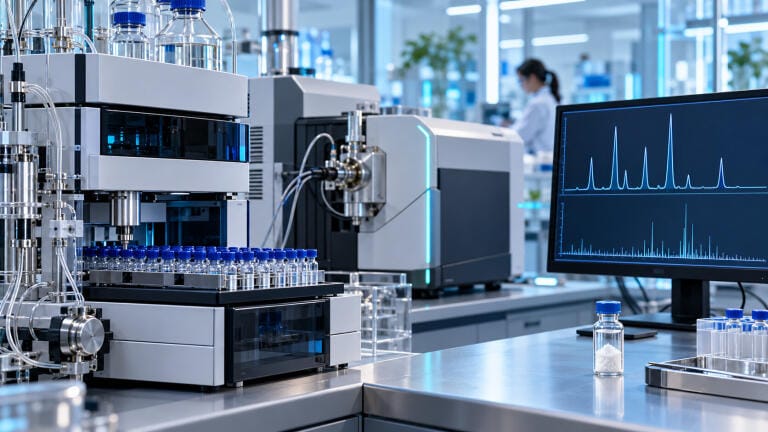
Most peptide CoAs report purity as area per cent from a RP-HPLC run with ultraviolet (UV) detection. The main peak’s integrated area is expressed as a share of the total integrated peak area in the chromatogram. Typical detection wavelengths sit near 214–220 nm, where the peptide bond absorbs strongly. [1,2]
That definition already embeds several assumptions: only species that absorb at the chosen wavelength contribute to the denominator, species that co-elute with the main peak are counted as part of it and non-UV-absorbing material, such as water and many salts, does not appear in the purity figure.
A 99 per cent HPLC purity result therefore does not mean that 99 per cent of the powder’s mass is the intended peptide. Net peptide content requires a separate measurement, as discussed below.
At ~214–220 nm the peptide backbone dominates the signal, which is useful for detecting truncated and deletion sequences that lack distinctive side-chain chromophores.
Aromatic residues (Phe, Tyr, Trp) also absorb in this region and at longer wavelengths (~280 nm), so method choice can change relative peak areas when aromatic impurities or protecting-group remnants are present. [1]
When reading a certificate of analysis (CoA), prefer one that states the detection wavelength and bandwidth and clarifies whether the trace is a single-wavelength chromatogram or a diode-array extract.
Treat purity figures with caution if no chromatogram is attached, since the trace is needed to identify shoulders, unresolved peaks or a rising baseline that could affect integration.
If the method uses a wavelength far from the peptide-bond region, ask for the reason; specialist methods may be appropriate, but the choice should be explained.
SPPS commonly produces deletion sequences (one or more couplings incomplete) and truncation products. These impurities often differ from the target by a single residue and can elute very close to the main peak on C18 (or similar) reversed-phase media. [2,3]
A steep gradient or a short chromatographic run can push those species under the main peak. A shallow gradient, a longer column, or a different organic modifier (eg., acetonitrile versus methanol, TFA versus formic acid as ion-pairing agent) can separate them. None of those choices is universally ‘correct’; they trade resolution against time and sensitivity.
For the buyer, transparency matters. The method should specify the column type and dimensions, the mobile-phase composition and any ion-pairing agent, the gradient table or isocratic conditions, the flow rate and temperature, and the integration start and stop rules, including whether peaks are integrated valley to valley or baseline to baseline. Without these details, two laboratories can report different purity values for the same lot while each remains internally consistent with its own method.
Even a carefully run reversed-phase high-performance liquid chromatography (RP-HPLC) method has blind spots. Isobaric or near-isobaric impurities that co-elute and have similar ultraviolet (UV) responses can inflate the main-peak area. Diastereomers and some modification products may resolve only partially as shoulders, which aggressive integration can merge into the main peak. Aggregation or solubility artefacts can also produce early or late peaks that, although not chemical impurities in the classical sense, still affect the percentage peak area.
This is why experienced peptide analysts treat HPLC purity as method-conditioned evidence, not as an absolute composition. Orthogonal methods (different column chemistry, capillary electrophoresis, or LC–MS) exist precisely because one reverse-phase method is not enough when the application is demanding. [3,4]
HPLC separates; it does not identify. Mass spectrometry – most often electrospray ionisation, ESI-MS, sometimes MALDI-TOF – answer a different question: does the main species have the expected mass for the stated sequence and modifications? [4,5]
A useful CoA for a synthetic peptide therefore pairs:
• an RP-HPLC purity figure with chromatogram and method
• MS data showing theoretical mass and observed mass (or a clear deconvolution), with the mass type labelled (monoisotopic versus average).
Charge-state envelopes are normal in ESI. Comparing a monoisotopic theoretical mass with an average observed mass (or the reverse) is a common source of apparent one-dalton ‘errors’. Systematic offsets can also flag chemistry rather than instrument error: roughly +16 Da for methionine oxidation, around +1 Da for deamidation in some contexts, or a loss equal to one residue mass for a deletion sequence. [5]
If the CoA shows HPLC purity alone, with no mass confirmation, the buyer cannot tell whether the main UV peak is the intended molecule or a closely related impurity that happens to dominate the chromatogram.
Lyophilised peptides almost always contain counter-ions (commonly trifluoroacetate from preparative RP-HPLC, or acetate after salt exchange) and residual water. Net peptide content (NPC), often measured by amino-acid analysis or nitrogen analysis, reports the fraction of the powder mass that is peptide. [2] NPC is often well below 100 per cent. Experiments that need accurate molar concentration should use NPC (or an equivalent assay), not HPLC area per cent alone.
A CoA that states counter-ion identity also helps when residual TFA is known to interfere with a downstream assay. These points are orthogonal to chromatographic purity, but buyers often conflate them.
When a new lot arrives, a few minutes spent checking its documentation can catch most problems. Confirm that the lot or batch number on the certificate of analysis (CoA) matches the vial label and that the sequence, modifications and counter-ion, if stated, match the purchase order. Check that the reversed-phase high-performance liquid chromatography (RP-HPLC) chromatogram is attached and specifies the wavelength, column and gradient. Review the integration for plausibility, including any unexplained shoulders merged into the main peak without comment.
Confirm that mass spectrometry (MS) identity data are present, that observed and theoretical masses agree within the stated tolerance and that the mono-isotopic or average mass is reported consistently. Check that the analysis date and any retest or expiry date are current and that storage conditions are given. The testing laboratory should be named; for critical applications, independent third-party testing is preferable to unnamed in-house claims.
Finally, file the CoA against the lot in the laboratory’s electronic laboratory notebook (ELN) or laboratory information management system (LIMS). None of these checks requires you to trust marketing copy: they involve reviewing the analytical evidence the supplier says it provides.
Editors and laboratory managers increasingly ask for reagent documentation that can survive audit. For synthetic peptides bought as research reagents, that documentation should at minimum make RP-HPLC method conditions and MS identity confirmation inspectable. Procurement teams can treat ‘purity ≥98 per cent’ without a chromatogram or mass match as incomplete and request the missing pieces before the material enters a regulated or highly replicated workflow.
Suppliers vary in how much of this package they publish by default. The scientific requirement does not: chromatographic purity claims for SPPS peptides are only as strong as the method that produced them, and they are incomplete without an orthogonal identity check.
An RP-HPLC purity claim is a useful summary of one chromatogram under one set of conditions. Wavelength, gradient and co-elution behaviour decide what that summary includes and excludes. Pairing HPLC with mass spectrometric identity confirmation, and separating purity from net peptide content, turns a single percentage into evidence a laboratory can defend. Buyers who insist on those elements are not being difficult; they are applying the same analytical scepticism they would apply to any other critical reagent.
Author bio: Sohail Khan works at Onyxhealth (trading as ONYX Research), a UK/EU supplier of research-use-only laboratory peptides. Khan writes about laboratory quality assurance and supply-chain documentation. Materials discussed are for laboratory research only and are not for human or veterinary use.
1. Mant CT, Hodges RS. Analysis of peptides by high-performance liquid chromatography. Methods Enzymol. 1996;271:3-50
2. Fields GB. Introduction to peptide synthesis. Curr Protoc Protein Sci. 2002;Chapter 18:Unit 18.1
3. Behrendt R, White P, Offer J. Advances in Fmoc solid-phase peptide synthesis. J Pept Sci. 2016;22(1):4-27
4. Domon B, Aebersold R. Mass spectrometry and protein analysis. Science. 2006;312(5771):212-7
5. Zhang Z. Prediction of low-energy collision-induced dissociation spectra of peptides. Anal Chem. 2004;76(14):3908-22
LMUK 51.7 Nov 2026


 Product directory