Chromatography
This work highlights how modern devices for continuous monitoring of liquid flow rates helps laboratories to optimise the performance of pump setups. Specifically, we used a high-resolution liquid flow meter to characterise various configurations of a peristaltic pump delivering reagents to a chemically regenerated membrane suppressor employed within a system for anion chromatography determination of the seven common inorganic anions fluoride, chloride, nitrite, bromide, nitrate, phosphate, and sulphate.
The peristaltic pump generated significant flow rate variations, and we could conclude that the measure that best predicted how much a particular pump configuration would affect the amount of background noise the chromatographic measurement was the flow pulsation, calculated as peak-to-peak variability within a two-minutes time frame. The worst pump configurations could thus be easily avoided by simply recording high-resolution flow rate data without performing the full chromatographic analysis.
Peristaltic pumps are attractive for continuous or intermittent dosing of liquid reagents thanks to their simple construction that avoids wetting of any other parts than the pump tubing. However, these pumps inherently generate flow pulsations which potentially can influence the accuracy and precision of the processes they are connected to. These flow pulsations are influenced by parameters such as the size and number of rollers squeezing the tubing, plus the diameter and positioning of the rotor. Such factors are set by the pump construction and thus differ between brands and models. To accomplish a certain volumetric flow rate, the user can vary the tubing inner diameter and material, plus the rotational speed, all of which also may affect the pulsation behaviour.
In chemical analysis systems including liquid chromatography, peristaltic pumps can be employed to continuously supply reagents to different post-column reaction devices. However, the impact of the pump configuration on the analytical precision of a specific instrument is difficult to be separately assessed. This may lead to suboptimal conditions for the analysis and result in higher background noise levels which reduces the overall precision of the analysis and restricts the attainable detection limits and quantification limits.
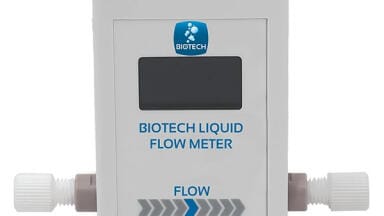
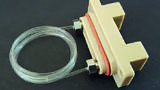
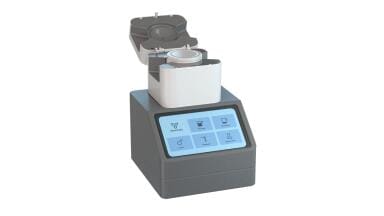
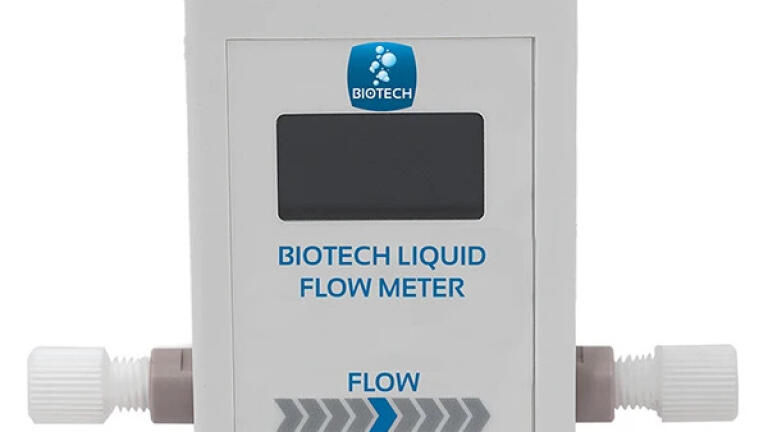
In this report, we used high-resolution data from a hand-held bidirectional liquid flow meter [1], see Figure 1, to test the effect of different pump tubing on flow pulsation, while keeping the average volumetric flow rate fixed. The same pump configurations were then employed for reagent supply to a chemically regenerated membrane suppressor [2] used during conductivity detection after ion chromatography separation of the seven common inorganic anions fluoride, chloride, nitrite, bromide, nitrate, phosphate, and sulphate, with a carbonate-bicarbonate eluent at conditions typically fulfilling the criteria specified in the official methods US EPA 300.1A, DIN/EN/ISO 10304-1 and ASTM D4327-17.
The recorded high-resolution flow rate data allowed us to correlate the flow pulsation behaviour of the peristaltic pump with chromatographic background noise levels and thereby suggest a simple test scheme for quick assessment of the suitability of different configurations to avoid the most problematic setups.
High-resolution flow rate data of ultrapure water was recorded during two minutes at 78 ms resolution using an AB-40010 Biotech Liquid Flow Meter [1] calibrated with water. The pump was a simple four-roller peristaltic pump (Shenchen LabS3 Minipump01) operated at various rotational speeds and equipped with either of four different sizes of thermoplastic elastomer pump tubing to deliver an average flow rate of 1 mL/min during each test.
We used four different PharMed BPT pump tubing with identical wall thickness (1/16”) and varying internal diameters of 1/16”, 3/32”, 1/8”, and 3/16”, which correspond to the standardised tubing sizes #14, #19, #16, and #25, respectively. All pump tubing were new and had been in use less than one hour before our tests.
Mean flow rate was calculated by taking the average of all data points during the recorded time window, and relative standard deviation (RSD) was calculated from the same data points. Flow pulsation was defined as the maximum value minus the minimum value within the two-minute dataset, in alignment of how analytical noise typically is calculated in liquid chromatography.
The ion chromatography analysis system consisted of a Metrohm 761 Compact IC with its conductivity detector and a Xenoic® XAMS Membrane suppressor [2] to which the characterised Shenchen peristaltic pump delivered a 10 mM sulfuric acid solution in ultrapure water at an average flow rate of 1 mL/min. A pressure relief valve (100 psi) was positioned between the column and the suppressor, and all interconnections were of 0.25 mm ID PEEK tubing. The eluent was a solution of 1.7 mM sodium bicarbonate and 1.8 mM sodium carbonate in ultrapure water (resistivity >18.2 Mohm) delivered at 1.0 mL/min, and the separation was performed on a Shodex IC SI-90-4E column (250x4 mm) onto which sample volumes of 20 µL was injected.
Mixed anion standards containing fluoride (2 ppm), chloride (3 ppm), nitrite (5 ppm), bromide (10 ppm), nitrate (10 ppm), phosphate (15 ppm), and sulphate (15 ppm) in ultrapure water were prepared from commercial 1000 mg/L single anion stock standards. Conductivity data were recorded with a frequency of 10 Hz, and each run lasted 20 min, where the time after elution of all anions from 14 minutes was used to extract three two-minute datasets for calculation of drift-compensated background noise. Three consecutive injections were performed with each peristaltic pump configuration, resulting in a total of nine noise data sets per setup.
Drift-compensation of the chromatography background was performed by determining the slope of the signal data during the recorded two-minute window and then normalising the signal against this slope before calculating noise. Analogous to the flow pulsation, chromatographic noise was defined as maximum minus minimum data value within the recoded two-minute window. Drift values were calculated as the slope within six minutes and extrapolated to one hour and might therefore be exaggerated.
The gathered flow rate data summarised in Figure 2a highlights significant pulsations of the pumped liquid, at intervals corresponding to the number of rollers passing per time unit. Especially notable was the repeated brief reversed flow with the larger tubing diameters, an effect that appeared most pronounced with the #16 tubing having 1/8” (3.2 mm) inner diameter. All displayed data were recorded with brand new pump tubing since we noted that slightly worn tubing tended to result in more distinct negative flow. This ageing effect was most pronounced with the size #16 pump tubing, with which we recorded negative flow rate pulses exceeding -3 mL/min, see Figure 2b.
These measurements confirm that the momentary negative flow from peristaltic pumps is a significant contributor to the pulsations, which agrees well with published theoretical calculations [3]. We therefore believe that the more extensive pulsation with the #16 pump tubing, likely was the result from a particularly unfortunate combination of rotor size, rotational speed, roller diameter, and tubing inner diameter.
Attempting to quantify the flow variations we calculated the relative standard deviation of the flow rate, see Table 1. The flow RSD indicated smallest variation for tubing #25 whereas the other were rather similar. In addition, the flow pulsation was determined, defined as the maximum variation within the two recorded minutes, see Table 1. Flow pulsation values were smallest for tubing #14 which had the narrowest internal diameter, followed by tubing #25 which had the largest internal diameter.
The four configurations of the peristaltic pump were thereafter used in an ion chromatographic setup for analysis of the seven common inorganic anions in water at conditions typically fulfilling official method criteria. The task of the peristaltic pump was to deliver a dilute sulfuric acid solution for continuous chemical regeneration of a membrane suppressor. It should be noted that no attempts were made to optimise the signal-to-noise ratio by varying the acid concentration or its flow rate, however, the conditions were set to ensure that the flux of acid (20 µmol/min) was sufficient to exchange the flux of sodium ions in the eluent (5.4 µmol/min) within the suppressor.
Injection of standards were performed, and the drift-compensated background noise was recorded after all peaks had eluted, as illustrated in Figure 3. Not with any of the setups could the distinct pulsation patterns from the peristaltic pump be detected in the recorded chromatograms, presumably due to dampening effects of the connecting tubing and the suppressor. The drift was less than ±0.1 µS/cm/h with all pump configurations and the signal intensity was very stable (<±3%, determined for sulphate).
The calculated chromatographic noise varied clearly between the various configurations of the peristaltic pump, as summarised in Table 1. The noise was less pronounced with the pump setups that showed the lowest flow pulsation, however, there was no clear correlation between the flow RSD and the chromatographic noise. To get an assessment of the noise without any contribution from the pump we also performed ion chromatography analyses with the pump turned off (thus relying on the inherent ion exchange capacity of the suppressor). This resulted in a more pronounced drift (ca -0.4 µS/cm/h), and an average noise of 1.49 nS/cm, thus indicating that the pump contributed to the noise even in its most favourable configurations.
To visually illustrate how the different pump configurations ranked in contribution to analytical noise, we plotted this data in a histogram with three bins; noise below 2 nS/cm, between 2-4 nS/cm, and above 4 nS/cm, see Figure 4. Here it was again clear that the pump tubing diameter showing the largest flow pulsation (i.e., #16) also resulted in the highest level of analytical noise. Conversely did the smallest and largest pump tubing inner diameters (#14 and #25, respectively) result in the highest population in the bins with the lowest level of noise, which consequently were the setups that was used in the continued suppressed ion chromatography analysis.
The recording of high-resolution flow rate data enabled us to characterise and compare several configurations of the peristaltic pump. This enabled avoidance of conditions that provided excessive flow pulsations and allowing selection of more appropriate operational parameters for the reagent delivery to the chemical analysis system. The measure that best represented how much a particular pump configuration would impact the analytical noise was relative flow pulsation calculated as peak-to-peak variation within two minutes, whereas the relative standard deviation of the flow rate showed low correlation.
ILM 51.6 Sept 2026


 Product directory