Laboratory products
Published over 7 years ago. See the latest and most current information on Laboratory products.
Imaging techniques are superior to traditional particle analysis methods in terms of information content and accuracy. Depending on the application, the particle size distribution can be based on the most appropriate size definition such as length, width, circle-equivalent diameter, stretched length, etc. In addition, only image analysis can determine and quantitatively describe important shape parameters like aspect ratio, circularity, or roundness. The laser diffraction technique only provides an equivalent diameter relative to a sphere model; in analytical sieving, the resolution of the distribution is limited to the sieves available, and the method is not reasonably applicable for samples in the lower micrometer range.
In particle characterisation, a distinction is made between static and dynamic image analysis. Dynamic image analysis is ideal for the routine analysis of bulk solids. Thanks to high sample throughput and low susceptibility to errors, this method is a great alternative to conventional sieve analysis.
Static image analysis is more likely to be used for narrow size distributions, with a focus on the precise characterisation of mostly fine particles. This method acquires high-resolution particle images which allow for size and shape measurement with highest accuracy. Static image analysis is based on a microscopic procedure in which a slide is photographed step by step and the particle images are evaluated automatically. With the CAMSIZER M1 Retsch Technology introduces a new analyser which is based on this principle.
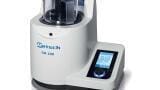
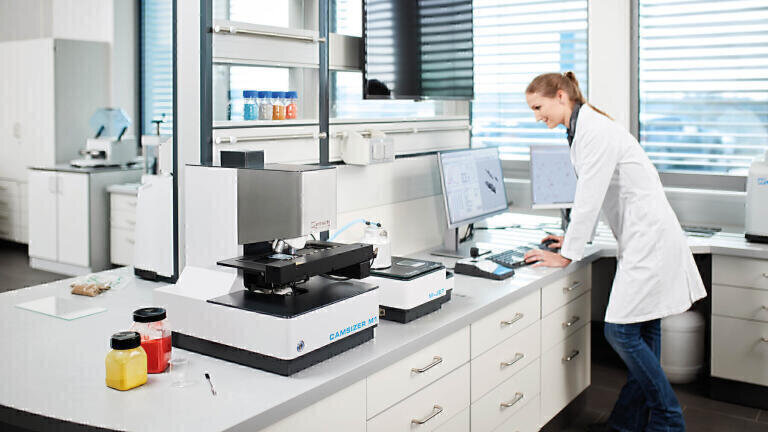
The CAMSIZER M1 (Figure 1) uses the principle of static image analysis to determine the particle size and particle shape. The five different objective lenses of the analyser cover different size ranges so that an overall measuring range of 0.5 µm to 1500 µm is achieved. At the start of each measurement, the particle size / particle shape analyser CAMSIZER M1 determines the focal plane for the measurement area which ensures that all particle images in the selected area are pin-sharp (tilt compensation). All image data and measurement data are stored during analysis, providing manifold possibilities for subsequent data evaluation with the Particle X-Plorer software module. When the measurement is finished, an overview image gives the user a good idea of the particle quality. Particles stretching over more than one measurement field can be pieced together by using the innovative stitching algorithm and may thus be evaluated although their size is larger than 1500 microns.
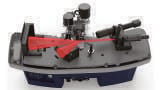
Figure 1. CAMSIZER M1 with dry dispersion unit M-Jet.
• 18 Megapixel colour camera
• Five objective lenses: 2.5x, 5x, 10x, 20x, 50x
• Illumination: transmitted light / reflected light
• Large sample stage (up to 8 standard slides)
• High-performance dispersion module M-Jet
Static image analysis is ideal for the characterisation of fine pharmaceutical ingredients and excipients.
The CAMSIZER M1 software allows the evaluation of individual images and clear visualisation of single particle images. The distribution of the particle width, particle length and the circle-equivalent diameter can be put out separately.
Figure 2. Analysis of paracetamol with the CAMSIZER M1. Upper left: image acquired at 10 x magnification, transmitted light. Upper right: Particles in the image are recognized and all relevant size and shape parameters are displayed. Clear and comprehensive graphical representation of the size distribution (lower left diagram) and the particle shape (lower right diagram). Measuring time: 9 minutes, number of images: 1600, number of particles: 120 000.
A polymer sample was pulverised by two different methods (ball mill and rotor mill) and analysed with the CAMSIZER M1. The median size is almost identical for both methods. Grinding in the rotor mill, however, produces particles with lower roundness values.
Figure 3. Polymer sample 1 was pulverised with a rotor mill, sample 2 with a ball mill. Both materials were analysed with the CAMSIZER M1, the median value is approximately 47 μm, with sample 1 having a wider distribution. The shape analysis shows that the sample from the rotor mill has lower values for the shape parameter ‘roundness’.
For modern powder metallurgical processes, e. g. selective laser sintering, raw materials with a narrow size distribution in the range of 20 - 80 μm are required. The particle shape should be as spherical as possible. With the CAMSIZER M1 unwanted particle shapes such as satellites (small metal particles fused with larger ones) are unambiguously identified which helps to correctly assess the suitability of the powder (Figure 4).
Figure 4. Top. CAMSIZER M1 particle list of titanium powder with a largely spherical particle shape. Satellites can be detected on some of the particles. Below: Copper powder with typical dendritic particle shape.
Industrial diamonds are frequently included in cutting tools and polishing products. Accurate knowledge of size, distribution width and particle shape are important for assessing the effectiveness of the material. Two samples of industrial diamonds were analysed with the CAMSIZER M1. The median values are 3 μm and 20 μm, respectively (Figure 5). This shows that the CAMSIZER M1 provides reliable results down to the low micrometer range.
Figure 5. Size distribution of industrial diamonds. Sample 1 (blue): median = 3.1 μm, sample 2 (red): median = 20.3 μm. The black curves represent the result of the laser diffraction analysis of the respective samples. This proves that the CAMSIZER M1 delivers exact size data even for very small particles. Right: CAMSIZER M1 images of industrial diamonds.
Glass spheres with a defined size distribution are often used to test and qualify particle analysers. With the CAMSIZER M1, the glass samples PS313 (10 - 100 μm) and PS202 (3 - 30 μm) from Whitehouse Scientific were analysed (Fig. 6). Sample preparation was carried out with the dry dispersion module M-Jet. For both materials, the results are within the specified tolerances of the standards.
Figure 6. Left. CAMSIZER M1 analysis of the PS313 sample, two measurements each on two different slides (red / blue). Right: CAMSIZER M1 analysis of the sample PS202. The black reference curves indicate the tolerance range of the standards. Centre: particle images of PS313 sample.
Static image analysis with the new CAMSIZER M1 is suitable for a variety of different applications. Particularly for very small particles, the CAMSIZER M1 impresses with its outstanding accuracy and reliable shape analysis. With the M-Jet module, homogeneous and efficient dispersion of dry powders is easily achieved. Fully automatic measuring procedure and various evaluation options make the CAMSIZER M1 the ideal measuring device for all applications in a size range from 0.5 µm to 1500 µm.
ILM 51.5 July 2026


-(1).jpg)
.jpg)

.jpg)


.jpg)