Laboratory products
Heterogeneous catalysts play a crucial role in the petroleum and chemical industries and are also used in environmental applications. Catalysts allow chemical reactions to take place under conditions in which they would not normally occur. They do this by reducing the activation energy barrier – a thermodynamic obstacle that must be overcome for a reaction to occur. Without a catalyst, much higher temperatures might be required, which can be prohibitively energy-intensive. Catalysts can also direct chemical reactions along a preferred path, enhancing the production of the desired target molecule while forming fewer by-products. Certain metals, metal oxides, and other reactive solids are chosen according to the specific reaction to be catalysed. Applications can vary widely from petroleum cracking, reforming, and hydrogenation to hydrogen production and automotive exhaust-emission control.
Whatever the ultimate application, there are two basic considerations for the catalyst. Firstly, surface chemistry must provide the desired functionality; for example, platinum rather than iron might be more suitable, or copper rather than silver. Secondly, enough catalytically active sites must be available to meet the output requirements of the process. Other considerations include, e.g., how the as-manufactured catalyst is activated and how it might be regenerated.
Therefore, there are a number of characterisation techniques that are recognised as essential for determining the quality of manufactured catalysts in terms of physico-chemical parameters. These are described in the article under each sub-section.
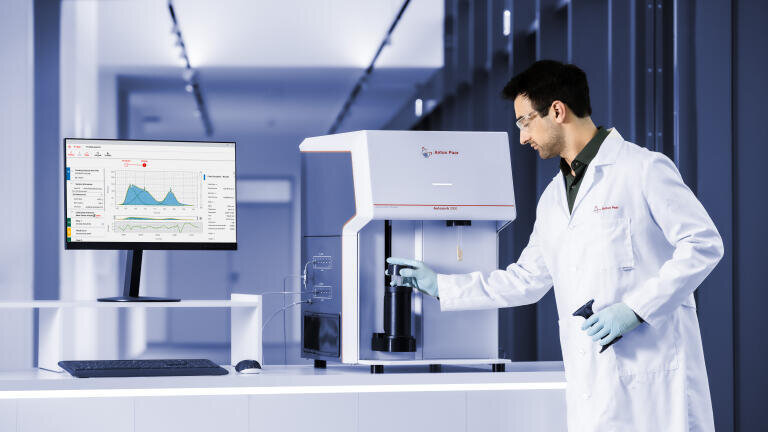
Flow chemisorption measurements, as distinct from static isotherm measurements, monitor differences in analysis gas composition resulting from adsorption, desorption, or reaction before and after the sample cell. These are measured using a thermal conductivity detector (TCD) and/or an optional mass spectrometer. The types of flow chemisorption measurements possible are summarised as follows, with experimental details where specific examples are given. All cited examples were performed using an automated flow-chemisorption analyser (Anton Paar’s Autosorb 3300), equipped with a water-cooled high-temperature furnace, a quartz flow-through sample cell (see Figure 1), precision mass flow controllers, and a TCD with four tungsten-rhenium filaments for enhanced sensitivity and oxidation and ammonia resistance, as well as an automated titration loop selector and injector.
Figure 1: Catalyst sample in a quartz sample cell. Quartz wool is used to prevent migration of fine particles, especially when characterising powders.
A reducing gas mixture, such as 5% hydrogen (H2) in nitrogen or argon, flows over the sample – typically a metal oxide (MO) – while it is heated at a predetermined linear rate. When a reaction occurs between the metal oxide and the hydrogen, the concentration of H2 leaving the sample cell decreases; when the reaction nears completion, the concentration of H2 returns to its initial level. The changes in H2 concentration produce a signal on the TCD that reflects the strength of the metal-oxygen bond. This evaluation of the ease of reduction is of fundamental importance to both catalyst manufacturers and users because it indicates how a metal oxide catalyst might be best activated in the reactor.
Example: MO + H2 → M + H2O
The water produced is usually removed from the reaction stream by a trap downstream of the sample so that it does not interfere with the hydrogen signal. The trap can be as simple as a small bed of hydrophilic zeolite acting as a strong desiccant, or some form of cold trap, as demonstrated in the temperature-programmed desorption experiment.
An oxidising gas mixture, typically oxygen (O2) in helium, flows over the sample – e.g., a coked catalyst containing carbon (C) – while it is heated at a predetermined linear rate. When a reaction occurs between the sample and the oxygen, the concentration of O2 leaving the sample cell decreases; when the reaction nears completion, the concentration of O2 returns to its initial level. The changes in O2 concentration produce a signal on the TCD that reflects the temperature at which (i.e., how easily) the sample can be oxidised and cleaned of carbon. This information can be used to understand the most appropriate conditions (usually the mildest) for the regeneration of a used catalyst, both in terms of oxygen concentration and temperature, without damaging it.
Example: M-C + O2 → M + CO + CO₂
In this specific example, 50 mg of pure graphite, a form of carbon, was subjected to a 10% mixture of O2 in He at a total flow rate of 50 sccm and heated at a rate of 5°C per minute to 1,100°C. The resulting signal is shown in Figure 2. The peak temperature (i.e., maximum oxidation rate) was reached at 717°C, although oxidation was already evident at temperatures below 600°C. The linearity of the heating rate is essential because any undulation or departure from linearity would produce a corresponding perturbation in the signal that is not characteristic of the sample under test. However, it should be noted that the exact peak temperature does depend on the heating rate; in fact, the shift in peak temperature as a function of heating rate in any ‘TPX’ measurement can be used to calculate the activation energy for the reaction.
Figure 2: Graphite TPO in 50 sccm 10% oxygen in helium flow (without vapor trap). TCD signal (cyan) and temperature (red) plotted vs. time.
A pure, inert carrier gas such as helium flows over a sample that has at least some previously adsorbed species – such as ammonia (NH3) on a zeolite (Z) or carbon dioxide (CO2) on a basic surface – while it is heated at a predetermined linear rate. When the temperature is sufficient to overcome the bond between adsorbate and adsorbent, the concentration of adsorbate leaving the cell increases; when the desorption nears completion, the concentration of adsorbate returns to zero. These changes in adsorbate concentration produce a signal on the TCD that reflects the strength of the bond between adsorbate and adsorbent or the strength of bonds within the solid itself. Because the same temperature-programmed flow approach can detect gaseous species released during heating, the thermal decomposition of certain compounds, such as oxalates and carbonates, can also be evaluated.
Example:
CaC2O4·H2O → CaC2O4 + H2O
CaC2O4 → CaCO3 + CO
CaCO3 → CaO + CO2
In this specific experiment, the value of a water vapor trap is demonstrated (Figure 3). In this case, it was important to trap only water vapor, not the evolved CO or CO2. A zeolite trap was deemed inappropriate because it traps CO2 in addition to the water. In its place, a slush bath of automotive anti-freeze and liquid nitrogen was used to obtain the desired effect. Two aliquots, each approximately 75 mg, were analysed using the following program: heating at a rate of 10°C per minute to 250°C, holding for 15 minutes to ensure complete decomposition of the monohydrate, and then heating at 20°C per minute to 925°C to effect the complete decomposition in the two anticipated steps. It is interesting to note that the major decomposition from anhydrous oxalate to carbonate is preceded by a small shoulder, usually characteristic of a specific lot of material, indicating factors such as purity, crystallinity, and particle size.
Figure 3: Calcium oxalate monohydrate TPD without vapor trap (blue) and with vapor trap (purple). The TCD signal is plotted versus temperature. The small step at 250°C represents the isothermal phase to ensure complete loss of water.
In acidic materials, such as many zeolites, the desorption temperature of ammonia is taken to be proportional to the acid strength and can be correlated with weaker Lewis and stronger Brønsted sites.
Example: Z-NH3 (ads) → Z + NH3 (des)
In the next experiment, four different zeolites were characterised by heating 50 mg to 80 mg of sample under pure helium at 20°C per minute to 700°C. The resulting profiles are clearly distinguishable (Figure 4). Peaks at or below 200°C are considered ‘weak’ and those at 300°C and above are considered ‘strong’. Note that the highest temperature peaks can be associated with the loss of structural protons and oxygen atoms to form water and resulting damage to the zeolite structure. The amount of NH3 desorbed can also be quantified by comparing integrated peak areas with those of injections of known amounts of pure ammonia gas.
Figure 4: Ammonia TPD from different zeolites obtained at 20°C per minute: NaY (green), fluid-cracking (pink), mordenite (purple), ZSM (blue).
A mixture of reactive gases flows over the sample while it is heated at a predetermined linear rate. When the temperature is sufficient to cause a reaction – e.g., between carbon dioxide (CO2) and H2 – any new gas produced, such as methane (CH4) in this case, is carried downstream. The changes in the concentrations of the reactive gases and newly produced gases can create a signal on the TCD; however, it is more usual to follow these reactions using a mass spectrometer, since in many reactions there could easily be more than a single product.
Example: CO2 + H2 → CH4
A pure, inert carrier gas, such as helium, flows over a sample that has been pretreated in situ to bring it to a reactive state, often referred to as activation – e.g., a metal oxide that has been reduced to a metal (M). The temperature is held constant (isothermal), typically not far above ambient. Fixed volumes of reactive gas – such as carbon monoxide (CO), H2, O2, CO2, or NH3, depending on the specific application – are automatically injected from a reactive gas sampling loop into the carrier gas flow upstream of the sample cell. These injections are known as pulses. Any reactive gas that is not adsorbed by the sample is detected by the TCD. The injections are repeated enough times to ensure that the surface is saturated with reactive gas. The adsorbed gas amount is calculated as the difference between what was injected (number of pulses x volume) and what was detected as unadsorbed using peak area integration. The adsorbed amount can be represented as the active metal area and is also used to report dispersion and crystallite size. Note that hydrogen usually dissociates on metals.
Example: M + M + H2 → MH + MH
Figure 5: Hydrogen dissociatively adsorbed on metals.
In these experiments, a typical hydrogenation catalyst (2 % platinum on alumina) was measured by titration with CO at 40 °C, using a loop of 275 μL. To evaluate the precision of the measurements, three discrete aliquots of the same lot of material, approximately 1 g each, were analysed a combined total of 10 times across three instruments, all Autosorb 3300 analysers. The results given in Table 1 are represented as both the amount of CO adsorbed and the percentage dispersion based on a 2 % loading of platinum. The average reproducibility, expressed as one standard deviation, across all aliquots and instruments was 0.46 % dispersion (2.7 % relative), with the greatest variability arising from differences between aliquots.
Table 1: Repeatability and reproducibility of metal dispersion (2% platinum on alumina).
Instrument Sample Volume adsorbed (μL/g) Dispersion (%)
1 A 385 16.8
1 A 388 16.9
1 A 396 17.2
1 B 375 16.3
2 B 368 16.0
2 B 370 16.1
2 C 396 17.2
3 C 397 17.3
3 C 397 17.3
3 A 385 16.8
A representative TCD trace from this series of measurements is shown in Figure 6. The first three peaks show incomplete but increasing degrees of coverage, while the last four peaks are indicative of complete saturation of the metal surface. A stable signal baseline with good separation of peaks produced results in less than 40 minutes. The approximately three hours preceding the measurement included pretreatment of the sample: degassing at 120°C to remove surface moisture, reduction with pure hydrogen at 400°C, purging with helium, and cooling to measurement temperature.
Figure 6: Example of carbon monoxide pulse titration results on a platinum catalyst.
Certain technical innovations have broadened the appeal of this type of measurement. When titrating a sample, it is beneficial to have a number of differently sized loops available. In this way, an excessive number of injections from a small loop can be avoided by switching to a larger loop. Typically, different loops must be manually detached and swapped, but modern instrumentation can switch between up to four automatically.
A specified mixture of reactive gas(es) and inert gas flows at a specified rate through a sample bed (SB) while the temperature is held constant (isothermal). When a reactive gas is completely adsorbed, it is absent from the downstream flow until the sample bed is saturated with a specific gas. At this point, the excess unadsorbed gas can produce a signal on the TCD, but it is more usual to follow these types of measurements using a mass spectrometer. The adsorption capacity can be calculated from flow rate, concentration, and breakthrough time.
Example: SB + N2 + CO2 → SB-CO2 (ads.) + N2
At saturation/breakthrough: SB-CO2 (sat.) + N2 + CO2 → SB-CO (sat.) + N2 + CO2
Characterisation of heterogeneous catalysts rarely requires a single technique or a single method within a given technique. One of the most powerful techniques is flow chemisorption, which comprises a group of temperature-programmed methods (TPR, TPO, TPD, and TPSR, collectively known as “TPX”), breakthrough curves, and pulse titration. Nevertheless, this family of methods may require adjustments to heating rates and/or gas mixture concentrations.
The broader adoption of these methods in catalyst production and early-stage research and development depends in part on the degree to which measurements are automated and integrated into a single system. When experimental conditions are well- defined and made user-independent through repeatable instrument settings and reproducible instrument responses – such as TCD signal and furnace linearity – these methods become suitable for routine characterisation in both novel catalyst development and industrial settings. This allows experts and non-experts alike to conduct the highest-quality measurements. For example, it is quite feasible to perform a TPSR in which a catalyst, whose metal area is initially determined by pulse titration, is deactivated by coking, followed by reactivation under TPO conditions, after which the active area can be re-evaluated by a second series of pulse titrations.
ILM 51.6 Sept 2026



 Product directory











.jpg)



.jpg)

.jpg)



.jpg)