Laboratory products
Published over 8 years ago. See the latest and most current information on Laboratory products.
The growing popularity of fluorescence-based analytical methods, especially in the highly regulated Life Sciences, has led to a demand for Reference Materials for Instrument Qualification. This article reviews some of the practical issues and the Reference Materials currently available.
The instrumentation used for fluorescence spectroscopy employs essentially the same technologies as are used for absorption spectroscopy, where the use of Certified Reference Materials (CRMs) for Instrument Qualification is very well established. Measurements by fluorescence spectroscopy, however, are subject to many more instrumental and physical variables than absorption measurements, so that the same sample may not give identical results with different instruments even if they are of similar design, or even on the same system on a different time/day. This can make it difficult to generate certified parameter values and explains why relatively few CRMs have been available for the technique. More recently, work at NIST in the USA and other National Metrology Institutes (NMIs) in collaboration with the commercial sector has led to the introduction of reliable fluorescence CRMs [1,2]. US Pharmacopeia General Chapter <853> contains recommendations for the qualification of fluorescence instruments using these references [3]. CRMs should be obtained from a recognised accredited supplier and have traceable value assignments with associated calculated uncertainties [4]. In an analogy similar to that where accreditation to ISO/IEC 17025 is seen as the standard of choice for Calibration and Testing laboratories, accreditation to ISO 17034 is now the recognised standard for Reference Material Producers.
Directly recorded or ‘uncorrected’ fluorescence spectra are rarely suitable for calibration purposes, inter-instrument or inter-laboratory comparisons, as they are usually distorted by instrumental factors such as variations in source intensity, optical reflectivity and detector efficiency with changing wavelength. These effects can, however, be minimised instrumentally by ensuring exact repetition of control parameters, or by software techniques to produce the ‘corrected’ spectra supplied with CRMs. These corrected spectra are reported in arbitrary units normalised to the highest, or peak, value. They are therefore not absolute values and so cannot be used as an absolute measure of instrument performance. They can, however be used to monitor instrument performance over time and to compare the performance of different instruments.
Physical sample effects such as quenching or self-absorption may lead to non-linearity in concentration/emission relationships over quite narrow concentration ranges. These effects are more pronounced at higher concentrations, so quantitative fluorescence measurements are usually more successful at the sub-micromolar level, using solutions typically having an optical density (absorbance) less than 0.05 A [5]. Some fluorescent materials exhibit photobleaching, or photodegradation, such that the fluorescence intensity may decrease after repeated excitation. Such materials are not suitable for use as CRMs but can have applications as Reference Materials (RMs) for the ordinate (wavelength) axis, provided due care is taken in their use to minimise the effect.
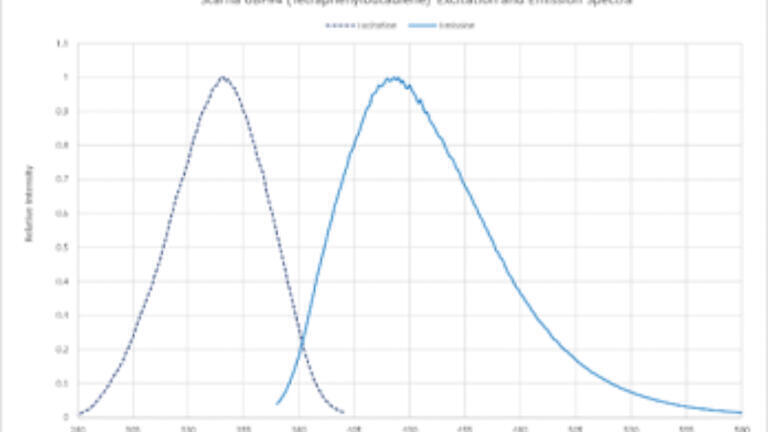
A given fluorescent sample has characteristic excitation and emission (fluorescence) spectra. These spectra can be well separated in wavelength, but sometimes there is significant overlap (Figure 1):
The optical system should be able to discriminate between the exciting and emitted radiation. In many instruments the emitted radiation is observed at 90 degrees from the exciting radiation, so in principle no exciting radiation should reach the detector, but this is not always the case in practise and light-scattering samples or stray reflections could cause some incident light to reach the detection system. Care is therefore necessary when selecting and using references with filter-based instruments or those with wide spectral bandwidths.
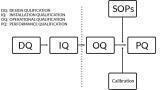
The parameters requiring qualification for Operational Qualification (OQ), and Performance Qualification (PQ) include wavelength, relative intensity (i.e. response) and sensitivity. Whilst OQ covers the published specification for a system, PQ should span the usual operating ranges required within the laboratory.
• Wavelength
Elemental spectral lines are a fundamental physical standard and, with very small uncertainty (± 0.01 nm), can be used to qualify the wavelength scale of a spectrofluorometer. The most often cited line source is the mercury arc, but its routine use may be inconvenient or impractical as it is necessary to place the lamp in the source or sample positions of the instrument and the positioning accuracy can affect the results [6].
Many spectrofluorometers use Xenon lamps as excitation sources, and their emission lines at 260.5 nm and 541.9 nm can be used as an internal calibration check. Best practice, however, requires that the wavelengths used for calibration should ‘bracket’ those used for analysis, so these lines may not qualify an instrument for a given application, whereas the rare earth oxide solution CRMs used in absorption spectrophotometry can provide a wide choice of certified wavelength values. The most popular, with 14 peaks over the range 240 nm to 650 nm, is Holmium Oxide solution in perchloric acid but other solution CRMs are available covering wavelengths from 190 nm to the near infrared. These are available in sealed cells that are simply placed in the sample position of the instrument together with a diffuse reflector to direct some of the transmitted light into the detection optics. A high performance spectrofluorometer has two monochromators, for the exciting and emitted radiation, and each must be qualified separately.
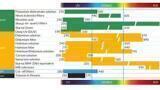
The design of some instruments is not amenable to the above method, and another approach is to use fluorescent Reference Materials with known excitation and emission spectra. Some aromatic organic compounds have excitation and emission spectra with peaks that are sufficiently sharp to be useful for wavelength qualification. These organic fluorescent materials can be incorporated into a solid polymer matrix that provides a stable environment for the fluorescent compounds. The solid polymer, generally polymethylmethacrylate (PMMA), materials are then cut and polished to the same dimensions as a standard spectrofluorometer cell. Anthracene, Ovalene, p-Terphenyl and Tetraphenylbutadiene are cited in Chapter <853> for this purpose [7] (Figure 2).
• Relative intensity (spectral response).
As mentioned above, an absolute measure of fluorescence intensity is not easy to achieve. Primary Reference physical methods include the use of calibrated light sources or detectors. Often used by NMIs, these tend to be costly and not appropriate for routine use in the analytical laboratory. Some fluorescent compounds, however, do produce a stable uniform matrix, which is resistant to problems such as photobleaching or photodegradation and are sufficiently stable over repeated measurements to be used as CRMs. Relative spectral intensities, normalised to the highest value, can be certified over a range of wavelengths. When the CRM is measured on another instrument the intensity ratios across the spectra should be identical if the instruments have the same performance. If not, correction factors can be calculated for the instrument under test, and the results used to compare and monitor instrument performance over time. Similarly, these correction factors can be used to convert directly recorded spectra of other fluorescent materials to corrected spectra, removing wavelength sensitivity bias.
Quinine sulphate dihydrate in perchloric acid was the first material to be used as a certified fluorescence reference and was characterised by the US Bureau of Standards in 1979 [8]. It can be used to qualify the spectral response of a spectrofluorometer over the range 375 nm to 675 nm and, over a limited concentration range (up to 1 mg/l), be used as a linearity check. Whilst it is no longer available from NIST as SRM 936a, in crystalline form; this CRM is now produced commercially in a permanently heat-fused sealed-cell format made up from the NIST material.
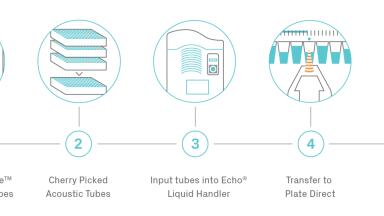
PMMA block references similar to those described above have been developed for spectral response qualification using proprietary organic dopants that have the necessary stability to be certified as CRMs. These can be produced in any physical format, to match appropriate sample handling/measurement formats, e.g. sampling tubes used with Polymerase Chain Reaction (PCR) protocols (Figure 3)
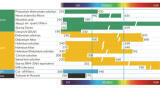
Glass block references containing stable inorganic ion fluorophores have also been developed, like the NIST SRM 294x series (where x = 0 to 4). Different ions yield different emission maxima: SRM 2942, Ce: UV emission (330 nm), SRM 2943, Cu: blue emission (446 nm), SRM 2941, U: green emission (526 nm), SRM 2940, Mn: orange emission (620 nm) and SRM 2944, Bi: red/NIR emission (704 nm). These are now becoming available from commercial suppliers (Figure 4).
While analytical precision is usually measured as part of method validation, the stability of these CRMs allows for determination of the precision contribution from the instrument itself.
• Sensitivity
Traditionally, the performance of spectrofluorometers was tested using dilute solutions of known fluorophores such as Quinine Sulphate or Rhodamine. Near the detection limit of a high-performance instrument, however, this is impractical because the necessary sample concentrations are so low that sample preparation becomes difficult and error-prone and there is high potential for sample contamination. An alternative approach is to use the Raman scattering of pure water. When excited at appropriate wavelengths, a very small proportion of the incident photons will be subject to Raman scattering and be emitted at a lower energy (i.e. longer wavelength) in a manner analogous to fluorescence. Because of the very small number of photons involved, the signal levels are very low and comparable to those produced by very low analyte concentrations in normal fluorescence measurements. Pure water exhibits a consistent Raman shift of 3400 cm-1, when excited by UV or visible radiation, so the Raman peak can be readily isolated. For example, excitation at 350 nm, results in a ‘Raman’ peak at around 400 nm (Figure 5).
The signal-to-noise ratio (sensitivity) can then be calculated using the relative intensity of this peak.
Certified Reference Materials have been developed that can allow the reliable qualification of spectrofluorometers despite the many variables encountered in fluorescence measurements. The range of references is expanding as developments continue in both NMIs and the commercial sector. The technologies used to manufacture the reference materials described in this paper can be used to produce references for other fluorescence techniques, and formats, such as plate readers, PCR and microscopy.
1. Paul C. DeRose, Recommendations and Guidelines for Standardization of Fluorescence Spectroscopy, National Institute of Standards and Technology, Publication NISTIR 7457, October 2007
2.Paul C. De Rose, NIST Workshop on Luminescence Standards for Chemical Analysis, J. Res. Natl. Inst. Stand. Technol. 105, 631 (2000)
3.United States Pharmacopeia General Chapter <853> 652-659
4. “Reference materials - Selected terms and definitions” (2015), International Organization for Standardization (ISO), Geneva, Switzerland.
5. Paul C. DeRose, Recommendations and Guidelines for Standardization of Fluorescence Spectroscopy National Institute of Standards and Technology, Publication NISTIR 7457, 8-9, October 2007
6. Paul C. DeRose, Recommendations and Guidelines for Standardization of Fluorescence Spectroscopy National Institute of Standards and Technology, Publication NISTIR 7457, 12, October 2007
7. United States Pharmacopeia General Chapter <853> 655
8. R A Velapoldi & K D Mielenz, NBS Special Publication 260-64, January 1980
9. Kovach, R.J., Peterson, W.M., “The Measurement of Sensitivity in Fluorescence Spectroscopy,” Am. Lab., 32G, (1994).Copy
ILM 51.5 July 2026


-(1).jpg)
.jpg)

.jpg)


.jpg)