Microscopy & microtechniques
Published over 15 years ago. See the latest and most current information on Microscopy & microtechniques.
Fluorescence can be used to report the location of bio-molecules or tissue of interest in vivo with high contrast to background. Through a series of fluorescent images taken at different time points, the development of diseases can be tracked in living organisms. Fluorescent proteins (FPs), because of their endogenous expression, allow the observation with minimal disturbance to the subject (Hoffman and Yang, 2006 a, b). For example, cancer cells can be engineered to carry FPs stably and implanted into the subject to allow monitoring of metastasis and the effectives of cancer treatment.
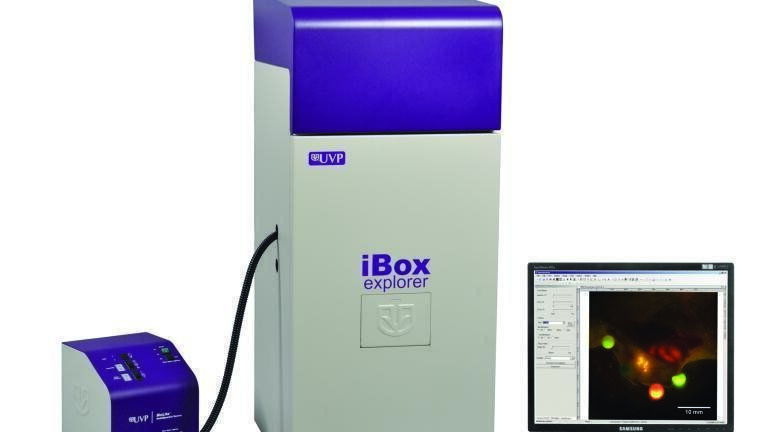
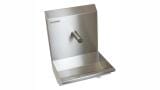
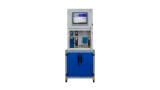
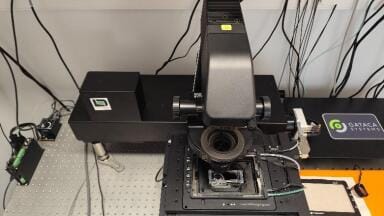
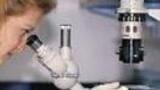
The UVP iBox® Explorer Imaging Microscope (Fig. 1) is capable of detecting fluorescent proteins from the whole organ to individual cells subcutaneously and within the body cavity. The high resolution camera and choice of four objectives provides maximum flexibility for imaging whole organs and cells in vivo. The typical exposures are less than 50 msec, minimizing the effect of animal movement. Fully automated optics permit reproducible and rapid imaging with software presets and macros. Directed dual excitation light paths and specially designed filters allow imaging up to the near IR range for detection of fluorescent tumors and cells labeled with GFP, CFP and RFP. The illustration below discusses the use of fluorescently labeled cells to track cells in vivo
Observing Cancer Cell Progression
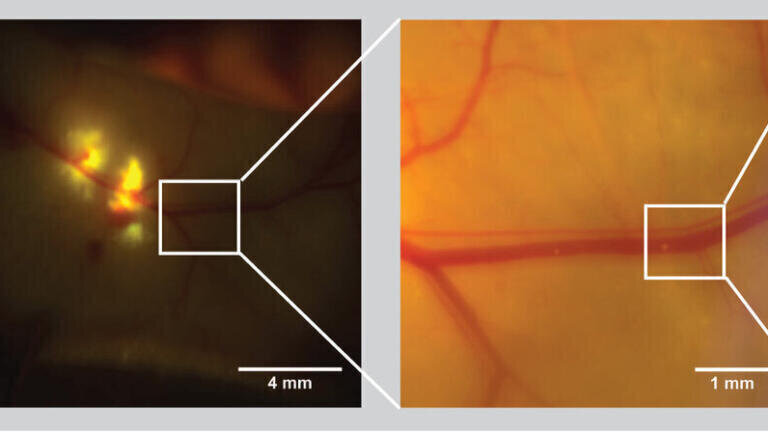
In this application, HT1080 fluorescent cancer cells were injected into the epigastrica cranialis. Immediately after the injection, the fluorescence indicates the cells escaped around the injection sites. Using the high-powered objectives, a cluster of cancer cells can be observed in the blood stream. (Fig 2)
Quantification of Tumor Size
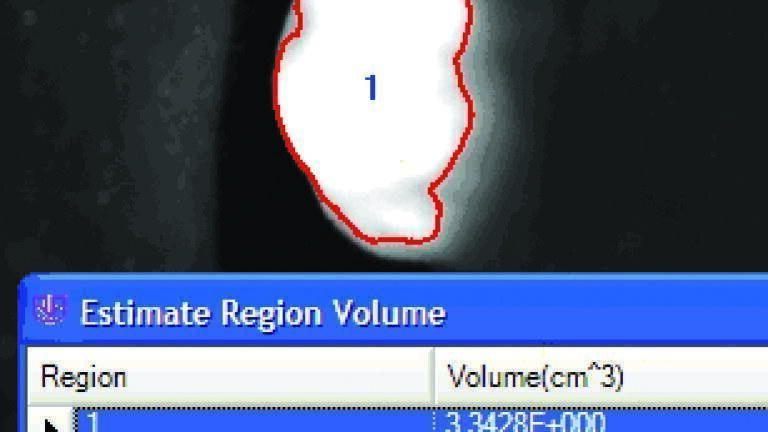
In addition to tracking the progression of individual cancer cells, the growth of the primary tumor can also be measured. There are two aspects in quantifying the result of in vivo imaging: the dimension and intensity. The quantitation of the dimension in vivo is to measure the relative coordinate and the length, area and volume of the signal. These numbers can report the tissue or organ expressing the targeted gene, and the development and the migration of such tissue. To accurately acquire these numbers, it is necessary to have contrast between the intensity of the signal and the background level. The researchers carefully define an intensity threshold distinguishing the signal and background based on their spectral characteristic and expected distribution. UVP’s VisionWorks Software estimates the tumor region and reports this information in a graphical and tabular format (Fig. 3).
Conclusion
Using fluorescent proteins to track small animal tumor growth provides the necessary indicators to visualize, detect, and measure the progression of cancer in vivo.
References
1. Hoffman, R.M. and Yang, M. Whole-body imaging with fluorescent proteins. Nat. Protoc. 2006, 1, 1429-1438.
2. Hoffman, R.M. and Yang, M. Color-coded fluorescence imaging of tumor-host interactions. Nat. Protoc. 2006, 1, 928-935.
Lab Asia 33.4 - August 2026


-(1).jpg)


-(1).jpg)
