Laboratory products
Published over 9 years ago. See the latest and most current information on Laboratory products.
Spectroscopy has been around for nearly 200 years, yielding critical measurements in a wide variety of areas of study. In the last two decades, hardware and software advances have made spectroscopy an even more versatile investigative and diagnostic tool, both inside and outside the lab.
It is now more practical than ever to apply spectroscopy to life sciences. New instruments provide great flexibility for a wide range of applications in biotechnology, medical diagnostics and other life sciences. Spectroscopy is suited to a variety of measurements including DNA, RNA, proteins, blood oxygenation in the lab, drug discovery, and even cancer detection and treatment. Once only available as large, expensive benchtop equipment, spectrometers are now compact enough for integration into point-of-care devices.
Of immense benefit is the ability to take measurements non-invasively. A number of measurements can be taken by shining light through the skin, a painless and non-destructive method. Spectroscopic measurements may one day provide a pain-free alternative to blood draws, diabetic finger sticks, and even surgical biopsies.
Since miniature spectrometers were first introduced in the 1990s, the mass production of optical fibres, development of less costly and more efficient detectors and optics, and the emergence of personal computers have driven the practical application of spectroscopy into a wider array of life science applications.
Mass market economies of scale have dramatically cut the cost of several critical components of spectroscopic sensing systems. As these parts have become more affordable, spectrometer optical benches have become smaller – with little or no sacrifice to performance. Now, miniature fibre optic spectrometers are portable enough to bring the sensor to the sample or integrate into handheld devices.
This hardware evolution has been complemented by advances in the evolution of personal computers, which allow spectrometers to process high-speed, high-resolution spectral data. The advent of compact, inexpensive and easily-programmed computer boards, such as Raspberry Pi, have sped device development. Spectral components can now be purchased affordably for initial engineering development and testing, and scaled to mass production.
Light interacting with tissue, blood and other biological samples reveals an abundance of detailed information. And it does it all non-invasively, in real time, and often, at lower costs per measurement than other methods. A practical application that demonstrates the utility of spectroscopy in life sciences is the use of modular spectroscopy for dermal measurements. Simple skin reflectance measurements reveal a surprising level of spectral data related to haemoglobin and skin tone.
Obtaining accurate, repeatable assessments of dermal characteristics is key to many studies into the efficacy and impact of ingested and topical drugs affecting pigmentation. Spectral reflectance measurements offer an objective way to measure skin throughout dermatological studies, providing quantitative data on colour and absorbance of skin.
By way of demonstration, development of models for melanin in skin were simulated. First, which spectra make up the total reflectance spectrum of skin were identified, then very simple models were developed to report a “Melanin Index” using just a few wavelengths.
Melanin is a dark pigment found in skin, contributing to skin tone and responsible for protection from solar radiation and the visible tanning of skin upon exposure to UV light. Surprisingly little is known about melanin, despite its key role in skin pigmentation. Melanin is the name for a group of insoluble biopolymers with various structures that have proven difficult to isolate and study. Melanin exhibits an unstructured absorbance in the visible portion of the spectrum that falls off exponentially with increasing wavelength. Despite its lack of structure, melanin could potentially be quantified spectroscopically using chemometric analysis.
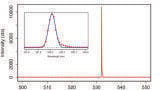
Other important constituents of skin tissue are haemoglobin and deoxyhemoglobin. Haemoglobin and deoxyhemoglobin are iron-containing metalloproteins responsible for oxygen transport in the body, and are found co-located with melanin in tissue. The visible spectrum of haemoglobin exhibits characteristic peaks at ~540 nm and ~580 nm, while deoxyhemoglobin peaks at ~560 nm. A pulse oximeter uses the difference in these two spectra to measure the oxygenation of blood using algorithms that are already very well understood.
Figure 2: Extinction spectra
The spectral absorbance of skin is heavily influenced by all three compounds: melanin, haemoglobin and deoxyhemoglobin. Skin from different regions on the body shows varying proportions of these compounds, as can be seen in the examples which follow.
Example 1: Reflection spectra of dorsal forearm skin in five individuals varying from light to dark skin tone shows significant variation across the visible and near infrared wavelengths. Note that haemoglobin absorption peaks are weak in this region, likely due to smaller blood vessels and the presence of tissue components that mask the haemoglobin spectral features. The reflectance spectra of measurements taken from this area are shown below.
Figure 3: Dorsal forearm reflectance
Example 2: Spectra of neck skin in reflectance (as measured close to the carotid artery) shows strong haemoglobin absorbance peaks at 540 nm and 580 nm in subjects with lighter skin tones. These peaks are much less pronounced in individuals with darker skin tones, likely due to absorbance of melanin and other skin components.
While the choice of sampling location is critical when performing spectroscopic measurements, chemometrics can aid in separating the contribution of these various spectral components, facilitating more accurate assessments of melanin content in skin regardless of location. With this goal in mind, we measured the spectra of skin in several regions of the body, from the UV to the NIR, in an effort to develop a simulated model of melanin content.
A dual spectrometer system was created with an Ocean Optics Flame-S-XR1 and a Flame-NIR to facilitate measurements from the UV through NIR. A single UV-Vis-NIR light source was used for illumination, with UV-Vis and NIR fibres collecting reflected light separately for routing to the corresponding spectrometer.
Skin reflectance was measured from 200-1650 nm at three locations: palm, forearm inside, and forearm top. One hundred spectra were collected at each location, yielding a total of 300 spectra. The spectra were recorded continuously, moving in no particular pattern and pausing for a few seconds at each location until the desired number of spectra were recorded.
A properly applied chemometric analysis would correlate the parameters measured physically in the lab to the spectra acquired for the same samples. As protocols and licensing is required to measure haemoglobin via chemical methods in the lab, an iterative procedure, MCR-ALS (multivariate curve resolution-alternate least squares) was used instead, to separate the spectra into meaningful chemical spectra in order to define “concentrations.”
In skin, there are a number of expected dominant chemical components:
• Melanin
• Oxyhemoglobin
• Deoxyhemoglobin
• Protein
• DNA
• Water
• Corneum (dead top layer of skin)
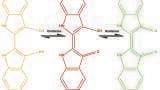
However, just as blood is both water and haemoglobin, some of these spectra might be coupled (i.e., correlated) and hard to separate. Additionally, if there is not enough variation in some of the parameters, they would be difficult to identify. By applying MCR-ALS, through trial and error, it was found that four components provided the best fit. Looking at the modelled spectral curves for these four components (see graph), component 1 (in green) appeared similar in shape to the known spectrum for melanin.
Figure 4: Result of MCR-ALS with 4 components
Component 2 (in orange) was found to be strongest on the back of the forearm and especially in the palm of the hand. Looking at the inside of the hand, the skin is thicker there, with a higher proportion of corneum. It may therefore correspond to the upper layers of the skin, which have lower water content (as indicated by the lower water absorbance peak in the NIR). Component 2 shows some cross-correlation with the haemoglobin peaks in the visible region, but that is to be expected when applying a very simplistic analysis model to such a complex matrix.
Based on the peaks between 500-600 nm and in the NIR, components 3 and 4 appear to represent a mix of haemoglobin, deoxyhemoglobin and water. No effort was made to measure skin that was predominantly oxygenated or deoxygenated, and thus we would expect these to be coupled.
Taking the extracted concentrations for melanin as a new ground truth, PLS-type chemometrics were performed on the 300 spectra for melanin. A five-component PLS model resulted in the best quality fit, predicting melanin concentration quite well (as can be seen below).
Figure 5: Melanin prediction of optimum model with 5 factors
Knowing that melanin concentration could reasonably be predicted with full-spectrum PLS modelling, an attempt was made to replicate this success with just four wavelengths. Carefully avoiding the known 520-600 nm range for haemoglobin and deoxyhemoglobin absorbance peaks, 400 nm, 450 nm, 490 nm and 700 nm were found to be the most promising wavelengths for predicting melanin concentration.
In fact, the four-wavelength PLS model based on these wavelength selections resulted in very good correlation between ‘measured’ and predicted melanin concentrations, comparable to what was found with the full spectrum.
Combining the absorbance at these four wavelengths as in the equation below therefore results in a fairly good ‘Melanin Index’, or approximation of melanin concentration in skin:
Melanin Index = Abs410 - 2*Abs450 + 2*Abs490 - Abs750
By measuring reflectance in skin over the visible and NIR range, it is possible to develop fairly simple multi-wavelength models for melanin and moisture concentration to facilitate studies of skin.
The opportunities for spectroscopy to be applied to biomedical challenges and medical diagnostics are significant. It’s already being studied for potentially life-changing advances in areas such as characterising the ageing of bruises in abuse victims and monitoring bilirubin concentration in neonates.
Even as new medical breakthroughs inspire applications not yet imagined, flexible instrumentation such as miniature, modular spectrometers continue to be updated and improved to keep up. In addition, there are newer detection technologies – advanced filter-based techniques, for example – that may reshape how spectroscopy can be applied.
Dieter Bingemann, PhD, is a Senior Applications Scientist for Ocean Optics. Bingemann is a chemist with extensive experience in laser and spectroscopic investigation techniques. He earned a doctorate in physical chemistry from Georg-August-Universität Göttingen (Germany) in 1994, and before joining Ocean Optics, was a professor of chemistry for more than a decade at Williams College (Williamstown, Mass.).
Cicely Rathmell, MSc, is a Marketing & Applications Specialist for Ocean Optics. In her 15+ year career in photonics, Rathmell has held various sales and technical positions at companies including JDS Uniphase, Semrock and Gulf Fiber Optics.
ILM 51.5 July 2026


.jpg)
.jpg)


-(1).jpg)

.jpg)


.jpg)