.jpg)
Mass spectrometry & spectroscopy
Polyetheretherketone (PEEK) is a high-performance, semi-crystalline polymer whose mechanical and thermal performance depends strongly on the degree of crystallinity established during processing. Differential scanning calorimetry (DSC) provides a reliable offline reference for crystallinity, but its results are normally available only after sampling and laboratory analysis. This article describes a process-analytical workflow according to which inline Raman spectroscopy is calibrated with DSC-derived reference values to monitor PEEK crystallinity during film extrusion. A Cora 5001 Raman spectrometer with a fibre probe was mounted on a Brabender Univex film haul-off unit connected to a Brabender MetaStation 8E single-screw extrusion line. Reference films were analysed on a Julia DSC 500. The combined method converts a Raman band ratio into a DSC-referenced crystallinity estimate, allowing crystallisation changes to be monitored during the extrusion run.
PEEK is used where polymers must withstand high temperature, chemical exposure, mechanical stress, and demanding dimensional tolerances. These properties are not determined only by polymer chemistry; they are also governed by morphology, in particular by how much of the polymer is present as ordered crystalline regions and how much remains amorphous. A film that is cooled too rapidly may contain a large amorphous fraction and can continue to crystallise later when exposed to heat. A film that crystallises more completely during processing may show higher thermal stability and different mechanical behaviour.
In film extrusion, crystallinity is controlled by a combination of melt temperature, draw-off speed, stretching, cooling drum temperature, film thickness, residence time, and ambient conditions. For process engineers, the challenge is that these variables act while the film is being made, whereas many analytical methods are applied only afterwards.
Differential scanning calorimetry (DSC) is well established for quantifying the thermal history and degree of crystallinity of PEEK. The method is performed on sampled material by weighing and sealing the specimen in a crucible before applying a controlled heating program and evaluating the resulting thermogram. As an established laboratory technique, DSC provides detailed characterisation of the processed material after extrusion.
Raman spectroscopy offers a complementary measurement approach. Using a fibre-optic Raman probe, the extruded film can be monitored in situ, non-destructively, and without contact, providing high temporal resolution for real-time process monitoring. The Raman spectra contain bands whose relative intensities vary with the degree of molecular order. However, Raman spectroscopy alone does not directly provide an absolute measure of PEEK crystallinity. Instead, DSC measurements are used as the reference method to calibrate a Raman-based prediction model. Once calibrated, the Raman signal serves as a process variable that enables continuous, inline monitoring of crystallinity during extrusion.
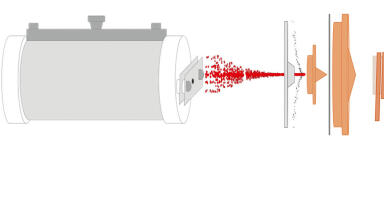
Figure 1: Raman probe integrated with the Univex film haul-off unit for non-contact Raman measurements of extruded and drawn PEEK film downstream of the cooling drums.
PEEK films were produced using a Brabender MetaStation 8E equipped with a 19/25D single-screw extruder and drawn through a Brabender Univex film haul-off unit (see Figure 1). A fibre-optic probe connected to a Cora 5001 Raman spectrometer was mounted above the film at the haul-off unit, downstream of the cooling drums. This configuration enabled non-contact Raman measurements at a stage where the effects of cooling-induced crystallisation had already developed in the film. For the Raman measurements, a 1,064 nm excitation laser was used to minimise fluorescence. The Raman measurements were performed using a laser power of 450 mW, a fixed exposure time of 4.9 s, and automatic background subtraction for each acquired spectrum. Spectra were recorded at 10 s intervals, and a rolling average over three spectra was used to smooth the process trace without losing the essential time dependence. These settings are important because a process model is only meaningful if the optical geometry, acquisition parameters, and preprocessing remain consistent between calibration and use.
Offline reference measurements were performed using a Julia DSC 500. For the purposes of this article, three PEEK film samples – designated Sample t5, Sample t8, and Sample t14 – were selected to illustrate the correlation between Raman spectra and thermal history. In practice, calibration of the Raman model requires a substantially larger set of DSC reference measurements spanning the expected range of crystallinity. Segments of the PEEK films were placed into 40 µL aluminium crucibles to ensure good thermal contact, sealed with pierced lids, and analysed under a nitrogen atmosphere. The masses of the three selected samples were 4.516 mg (Sample t5), 8.458 mg (Sample t8), and 10.506 mg (Sample t14). The heating program started at ambient temperature and ramped to 380°C at 10 K/min.
The first heating run is particularly informative because it contains the thermal history generated during extrusion. The crystallinity calculation is based on two heat-flow events. The melting endotherm reflects the energy required to melt crystalline regions. Cold crystallisation, if present, reflects additional crystals that form only during the DSC heating scan. To estimate the crystallinity already present in the as-processed film, the cold crystallisation enthalpy is subtracted from the melting enthalpy and the result is normalised to the enthalpy of fully crystalline PEEK:
Here, ∆Hm is the melting enthalpy, ∆Hc is the cold crystallisation enthalpy, and ∆Hm is the theoretical melting enthalpy of fully crystalline PEEK. The subtraction is essential: Crystals that form inside the DSC during heating should not be counted as crystallinity that already existed in the extruded film.
The Raman model used a simple band-ratio approach. The band at 1,144 cm-1, assigned to a C-O-C stretching mode, was selected as the crystallinity-sensitive contribution. The band at 1,598 cm-1, associated with aromatic ring stretching, was used as the second intensity in the index (see Figure 3).
Figure 2: Normalised spectra with the order-sensitive C-O-C band at 1,144 cm^-1 and the aromatic ring band at 1,598 cm^--1 highlighted.
In practical terms, the ratio I1144 / (I1144 + I1598) behaves as a semi-empirical descriptor of the crystalline/amorphous balance in the film. It is not an independent definition of crystallinity; it becomes quantitative only after calibration against DSC-derived values.
Low- and high-crystallinity states observed during extrusion were sampled and analysed by DSC. These reference points were used to establish a linear relationship between the Raman index and DSC-equivalent crystallinity. After calibration, the model can be applied to each inline Raman spectrum and visualised as a continuous crystallinity trace during extrusion.
DSC distinguishes as-processed crystallinity from crystallisation during heating
Figure 3: DSC thermograms of three PEEK samples obtained t different time points during extrusion, showing the glass transition, cold crystallisation, and melting regions. Differences in the thermograms reflect the distinct thermal histories experienced by the PEEK films.
Table 1: DSC results from the thermograms of the three PEEK samples used to calculate crystallinity and for calibration of the Raman data.
Sample t5 t8 t14
Cold crystallisation peak temperature [°C] 172.91 172.47 -
Cold crystallisation enthalpy [J/g] 25.64 25.06 -
Melting peak temperature [°C] 337.77 341.04 340.02
Melting enthalpy [J/g] 41.91 43.18 42.12
Crystallinity χ_c [%] 12.5 13.9 32.4
The three DSC curves in Figure 3 show why both melting and cold crystallisation must be considered. Sample t5, a thin film drawn at 5.0 m/min, exhibited a glass transition midpoint at 145.06°C, a pronounced cold crystallisation peak at 172.91°C, and a melting peak at 337.77°C. The cold crystallisation enthalpy was 25.64 J/g, while the melting enthalpy was 41.91 J/g. The large cold crystallisation peak indicates that a significant amorphous fraction remained after processing and crystallised only during DSC heating.
Sample t8, processed at 2.0 m/min, also showed cold crystallisation, with Delta Hcc = 25.06 J/g and Delta Hm = 43.18 J/g. Its melting peak appeared at 341.04°C. The thermogram is consistent with partial crystallisation during processing, but not complete crystallisation. The material still had sufficient amorphous content to crystallise during the DSC heating ramp.
Sample t14, produced at the slowest drawing speed of 0.8 m/min, behaved differently. Its DSC curve showed no significant cold crystallisation peak and a melting enthalpy of 42.12 J/g at 340.02°C. The important point is not that Sample t14 had the largest melting enthalpy – it did not. Rather, the absence of a cold crystallisation peak means that the crystals observed during melting were already largely present before the DSC scan.
Using 130 J/g as a commonly applied reference enthalpy for fully crystalline PEEK, the approximate crystallinities are 12.5% for Sample t5, 13.9% for Sample t8, and 32.4% for Sample t14.
Based on the DSC measurements, a direct correlation was established between the Univex’s rolling speed and the degree of crystallisation; in other words, the faster the film was unwound, the lower the degree of crystallisation.
The Raman spectra showed measurable differences between low- and high-crystallinity states in the spectral region used for the band-ratio model. Once the index had been calculated over time, the process tracking revealed characteristics that were difficult to reconstruct based solely on individual offline samples. For instance, Figure 4 describes dips in relative crystallinity around minutes 3 and 8, followed by a strong increase between minutes 9 and 11. After this transition, the signal reached a relatively constant high-crystallinity regime.
Figure 4: Raman-derived crystallinity during extrusion.
When the DSC-calibrated model was applied retrospectively to the inline data and plotted together with the Univex haul-off speed, changes in draw-off speed produced measurable changes in Raman-derived crystallinity (see Figure 5).
Figure 5: Dependence of crystallinity on draw-off speed for PEEK.
Decreasing draw-off speed below 3 m/min led to a strong increase in crystallinity up to a critical processing threshold. This behaviour may be attributed to the increased time available for crystal growth and molecular ordering prior to solidification. At lower take-off speeds, the PEEK film is fed more slowly onto the rolls of the Univex device at the same extrusion speed, resulting in a thicker film, slower cooling, and consequently a higher degree of crystallisation.
At higher draw speeds (3 m/min to 5 m/min) the crystallinity fluctuates to a greater or lesser extent, with values around 15%. This suggests that only if the draw-off speed is reduced to lower than 3 m/min can values of around 32% be achieved. At lower draw-off speeds of 2 m/min to 3 m/min, the crystallinity is stable.
The strength of the workflow lies in the different roles of the three techniques. The extrusion line generates controlled process variation and produces films with different thermal histories. DSC provides the offline reference needed to translate heat-flow signatures into crystallinity values. Raman spectroscopy then transfers this information into the running process, where the time resolution is high enough to reveal transitions, plateaus, and instabilities.
For process development, this matters because crystallinity is not merely a final certificate value. It is a response to the process window. Inline Raman can help identify the speed range in which crystallinity changes most strongly, the region in which a plateau is reached, and zones where other effects disturb the relationship between speed and morphology. The practical value is a more direct link between process settings and polymer structure. Potential benefits include faster development cycles, earlier recognition of deviations, fewer offline trial-and-error loops, reduced material waste, and a more robust basis for scale-up. These are process-analytical benefits rather than instrument-only benefits; they depend on well-designed calibration and representative sampling.
Several points should be considered when transferring the method. First, the Raman result is DSC-calibrated and should be described as DSC-equivalent crystallinity within the calibration space. Changes in PEEK grade, additives, film thickness, optical geometry, temperature, cooling rate, or surface condition may require verification or recalibration. Second, post-crystallisation can occur between inline Raman acquisition and later DSC sampling. The DSC reference may represent a state that differs from the instantaneous state at the time of Raman measurement. Third, in the DSC film comparison, multiple process variables can have changed simultaneously. The effect of draw history on crystallinity can only be demonstrated if other variables are kept constant during the experiment.
The application demonstrates a practical pathway from offline polymer characterisation to inline process monitoring. DSC remains the reference method for quantifying the crystallinity of PEEK films because it directly measures the melting and cold-crystallisation enthalpies. Raman spectroscopy complements DSC by adding the temporal dimension: once calibrated against DSC reference data, it tracks crystallinity-related spectral changes during extrusion and translate them into a continuous estimate of crystallinity. Rather than replacing DSC, Raman extends its value to real-time process monitoring. Together, DSC provides the reference measurements, Raman enables continuous inline monitoring, and the extrusion process supplies the controlled variation required to understand and optimise crystallisation.
• Anton Paar Application Report XPAIA163EN-C: Combining Extrusion and Raman Spectroscopy - Monitoring of Crystallinity in PEEK Film Extrusion.
• Anton Paar Application Report E25IA018EN-A: Crystallinity analysis of polyetheretherketone (PEEK) films, derived from ASTM F2778-09.
• ASTM F2778-09: Standard Test Method for Measurement of Percentage Crystallinity of Polyetheretherketone (PEEK) Polymers by Means of Specular Reflectance Fourier Transform Infrared Spectroscopy.
ILM 51.6 Sept 2026




 Product directory













.jpg)

.jpg)
.jpg)
.jpg)