Laboratory products
Published over 15 years ago. See the latest and most current information on Laboratory products.
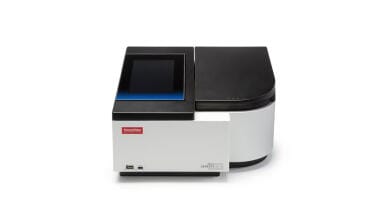
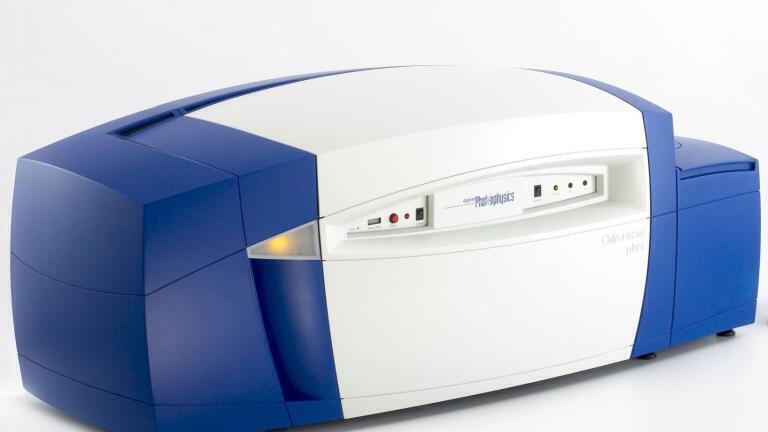
Applied Photophysics is pleased to announce the Chirascan™-plus Automated Circular Dichroism spectrometer (ACD), a fully automated version of the world-leading Chirascan™-plus. Automation improves measurement reproducibility, reduces sample usage and transforms the productivity of CD spectroscopy, offering scientists the opportunity to study the conformational stability of proteins with much greater confidence and much less effort. Typical applications include the influence of pH, ionic strength, detergent, mutation and ligand binding on protein conformation, which is important in biotherapeutic development, formulation testing and clone selection.
The growing interest in proteins as therapeutics means it is increasingly important to understand their conformational stability and to do so as early in the development process as possible. If a protein is not correctly folded, it will not execute its function properly, may aggregate and may even be immunogenic. CD spectroscopy is a sensitive probe of protein conformation and Chirascan™-plus ACD offers considerable advantages over manual operation:
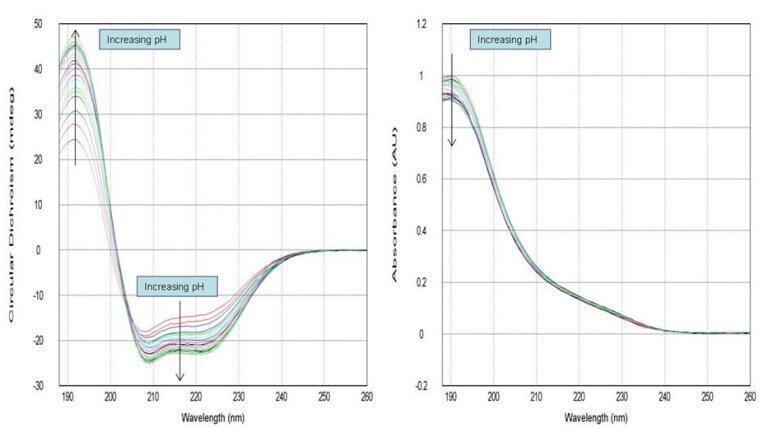
In a recent study, Mapping Protein Stability Using Automated CD, the robustness of the technique and data quality are demonstrated using the model protein bovine serum albumin (BSA).
Figure 1: Citrate-phosphate-buffered solutions of BSA were studied from pH2.2 to pH8. Buffer-subtracted CD and absorption spectra show the quality of automated data and changes in protein confirmation (260nm ≥ λ ≥ 188nm)
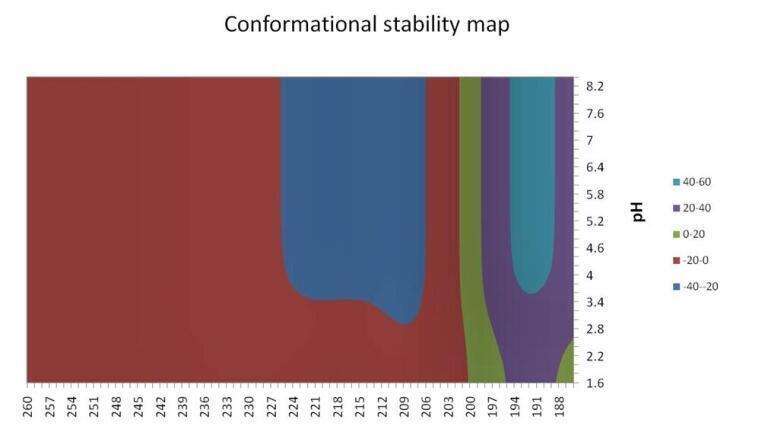
Figure 2: Globally fitted data presented as a conformational stability map show clearly where the conformation is stable (pH>4.5) and where it is not. pKa values together with end-point and intermediate spectra are also calculated.
The automated sample preparation and measurement of CD now enables experiments to be undertaken that were previously thought to be too time consuming or laborious, significantly extending the range of applications and usefulness of the technique.
Find out more by contacting us at:
USA 1-800 543 4130, EU +44 (0) 1372 386537
ILM 51.5 July 2026

.jpg)


-(1).jpg)
.jpg)
.jpg)