
Mass spectrometry & spectroscopy
Published over 9 years ago. See the latest and most current information on Mass spectrometry & spectroscopy.
FTIR absorption spectroscopy is an ideal analytical technique to characterise new, used and diluted motor oils, as well various other samples.
Service oils, like Castrol’s Magnatec engine oil, are designed to minimise wear-and-tear in engines.
After a while, the oils pick up elemental metals, soot and other contaminants which turn the fresh yellow oil into a dark and worn black.
IR spectral analysis can help determine which contaminants are present, as well as what kind of chemical degradation occurs in the oil.
Traditionally, a vertically mounted cell was always the standard method of loading viscous or sticky fluids, which posed many problems including sample introduction and clean up.
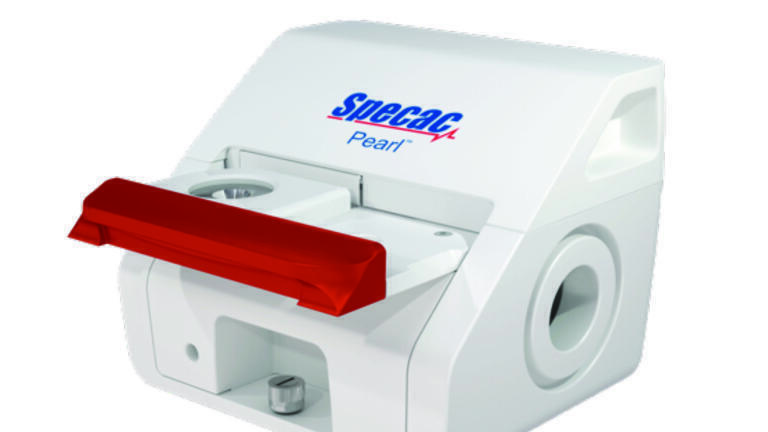
However, The PearlTM liquid transmission accessory is designed to make the IR spectral measurement of liquids quick, easy and highly repeatable.
The PearlTM accessory (P/N GS31000-B) was used in conjunction with fully-wedged ZnSe windows in the Oyster Cell. Three different pathlengths were used; 25, 50 and 100 microns.
The oil samples tested included a fresh sample of Castrol Magnatec, as well as a used sample after 18 months of use in a petrol engine.
Fresh Renolin CL37 and 68 oils were also analysed. The spectra were recorded with a 1 cm-1 resolution, using The PearlTM coupled with an FTIR spectrometer.
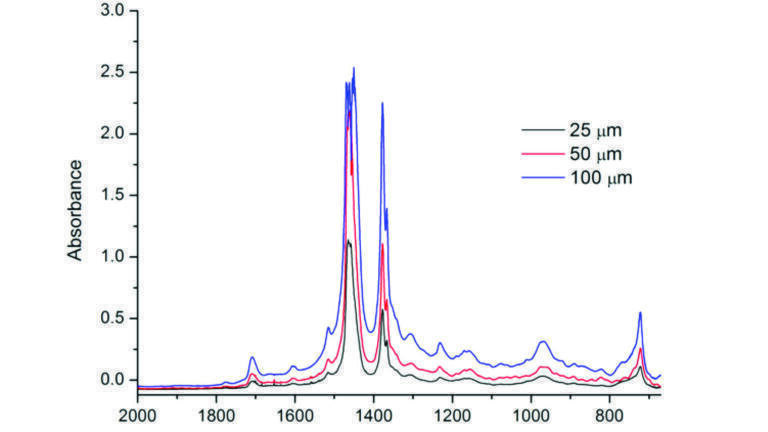
Figure 1 shows three spectra for a fresh sample of Castrol Magnatec motor oil, recorded using three different pathlengths: 25, 50 and 100 µm.
The absorbance increases with increasing pathlengths in the Oyster Cell, as can be expected.
It is worth noting that the oil samples had not been diluted, so they were at their maximum concentration during analysis. Despite this, the maximum absorbance in fingerprint region (500 – 1500 cm-1) peaks at 2.5 for the 100 µm pathlength.
This demonstrates that no dilution or sample preparation is needed to record the transmission spectrum of oil samples with 25, 50 or 100 µm pathlength windows.
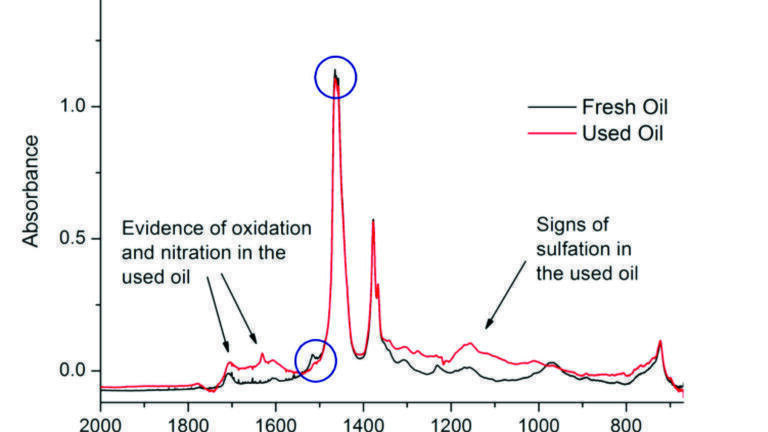
Figure 2 compares the spectra of fresh and used Castrol Magnatec oil samples using a 25 µm pathlength.
Very little sample, < 5 ml, was needed to quickly differentiate the oils.
The used sample shows evidence that the oil has been chemically altered and that contaminants have been introduced.
Around 1150 cm-1, the hallmark signs of sulphation are visible, while the region of 1600 – 1700 cm-1 shows evidence of oxidation and nitration in the oil.
Conversely, there is a loss of relative signal intensity at 1500 and 1460 cm-1.
This is marked by blue circles and indicates there is less of the original oil in the used sample.
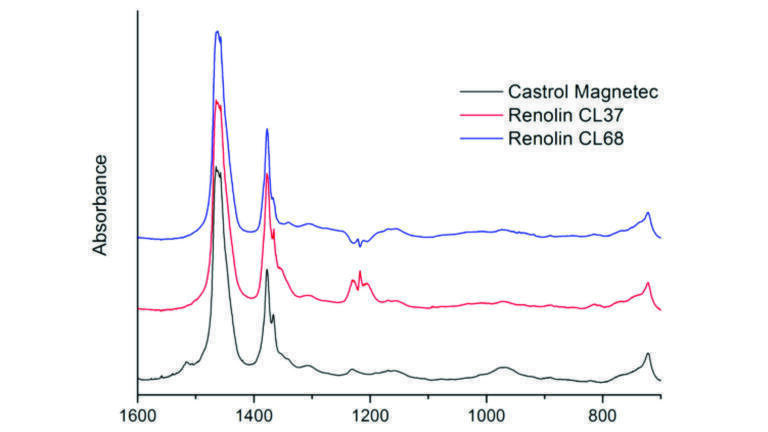
Figure 3 compares three different fresh oil samples measured using a 25 µm pathlength, in black, red and blue, respectively:
Clearly, the oils share a similar aliphatic band at 1470 cm-1, but their other molecular signatures are different.
FTIR spectroscopy is a well-known tool for the characterisation of various samples.
This note highlights that viscous oil samples can be analysed simply and quickly using three different pathlengths in The PearlTM.
Very little sample was needed to differentiate the oil samples.
Moreover, the used samples showed evidence that contaminants had been introduced over time through use and contact with machinery.
The subtle spectral signatures between different oils, whether fresh or used shed light on the chemistry of the samples.
A loss of signal intensity at certain frequencies indicated that the original oil sample had been chemically degraded through use in a car engine.
The fact that the maximum absorbance in the fingerprint region (500 – 1500 cm-1) peaked at 2.5 for the 100 µm pathlength shows that a few drops of pure sample is enough to record top quality transmission spectra.
More in-depth studies to determine how quickly the oils degrade with use can easily be carried out using The Specac PearlTM.
Email or visit the website for a free demonstration or more information.
ILM 51.5 July 2026


-(1).jpg)
.jpg)
-(1).jpg)
.jpg)