
Laboratory products
Published over 5 years ago. See the latest and most current information on Laboratory products.
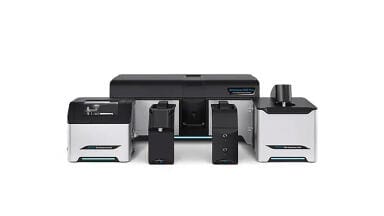
The Pearl™ liquid transmission accessory makes the IR spectral measurement of even the most viscous liquids quick, easy, and highly repeatable.
Service oils, like Castrol’s Magnatec engine oil, are designed to minimise wear-and-tear in engines. Over time the oils pick up elemental metals, soot and other contaminants which visibly spoils the oil
IR spectral analysis can help determine which contaminants are present, as well as what kind of chemical degradation has occurred in the oil. Traditionally, a vertically mounted cell was the go-to method for loading viscous or sticky fluids. However, this approach leads to problems with sample loading, consistent pathlengths, and cell clean-up. Read on to discover how the Pearl™ easily overcomes these issues.
Fresh samples of Castrol Magnatec, Renolin CL37 and CL68 oils were analysed, alongside a sample of Castrol Magnatec which had 18 months of service in a petrol engine.
The oil samples were loaded into Oyster cells fitted with wedged ZnSe windows. Three cells with fixed pathlengths of 25, 50 and 100 µm, were used and mounted in a Pearl™ accessory. Spectra were recorded at a resolution of 1 cm in a commercial spectrometer.
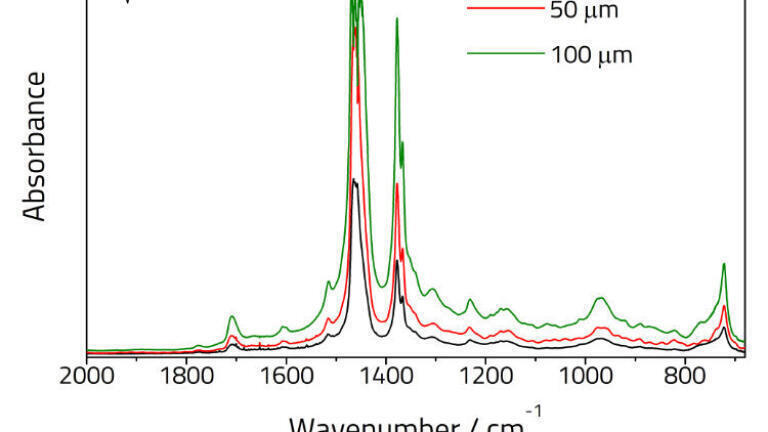
Figure 1 shows three spectra for a fresh sample of Castrol Magnatec motor oil with no dilution, with three different pathlengths: 25, 50 and 100 µm. As expected, the absorbance increases with increasing pathlengths. The maximum absorbance in the fingerprint region (500 – 1500 cm) is 2.5 for the 100 µm pathlength. This demonstrates that no dilution is needed to record the transmission spectrum of oil samples.
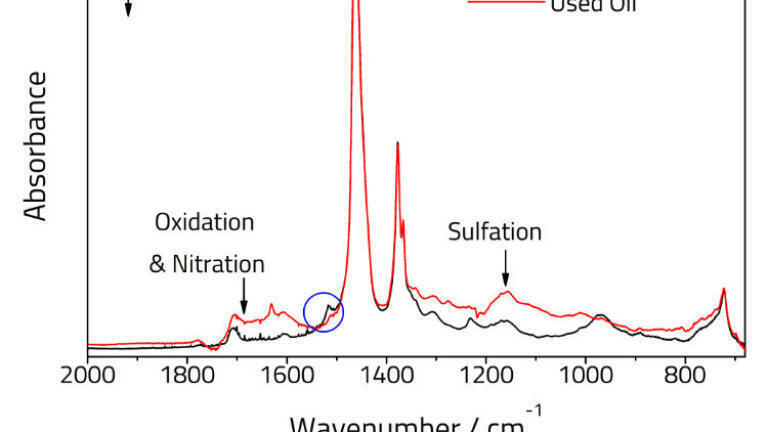
Figure 2 compares the spectra of fresh and used Castrol Magnatec oil samples using a 25 µm pathlength. Very little sample (< 5 ml) was needed to quickly differentiate the oils. The used sample shows clear evidence that the oil has been chemically altered and presence of contaminants.
Evidence of sulfation is observed by the growth of bands around 1150 cm, while 1600 – 1700 cm region shows evidence of oxidation and nitration in the oil. There is a loss of relative signal intensity at ca. 1500 and 1460 cm. This is marked by blue circles and indicates a decreased concentration of the original oil in the used sample.
Figure 3 compares three different fresh oil samples measured using a 25 µm pathlength. The oils share a similar aliphatic band at 1470 cm, but their other molecular signatures are different and could be used to distinguish between different manufacturers and specifications.
For more on this app note feel free to click here and see the conclusions to the experiment. To view more of Specac’s Application notes you can find them at our website.
ILM 51.5 July 2026


-(1).jpg)


.jpg)


-(1).jpg)
