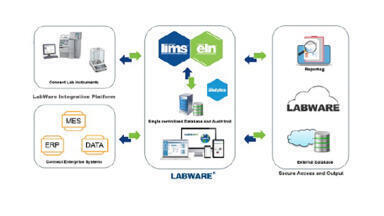
With
clinical laboratory IT solutions handling an increasingly dynamic workload, the Technical Research Centre of Finland has created a means of assessing continual quality.
Scientists at the institution explain that 'smart' environments must deal with changing user bases and the addition and removal of devices.
As a result,
clinical laboratory IT solutions may be faced with multiple pieces of software interacting with one another at any one time.
This presents a difficulty in terms of determining how well the system is working at one time, compared with another point when the demands placed on it have changed.
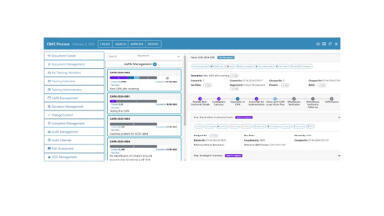
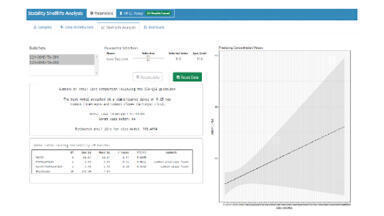
In order to overcome the problem, the researchers have created a visualisation procedure which assesses variability across a range of quality metrics.
Analysis is made possible through timelines, charts and meters to help display this information in a usable form.
The centre is northern Europe's largest multi-technology applied research facility and operates under the domain of Finland's Ministry of Employment and the Economy.


.jpg)
.jpg)


-(1).jpg)