Laboratory products
Published over 5 years ago. See the latest and most current information on Laboratory products.
Infrared quantitative analyses are an everyday requirement in the analytical laboratory. While liquid solutions are commonly analysed, mixtures of powdered components also exist and often require quantitative analysis without dissolution into a solvent.
The traditional infrared analysis method for powdered samples is the collection of a KBr pellet spectrum of an aliquot of the powdered sample. However, preparation of KBr pellets requires skill, and precise weighing of every component for each sample. The Golden Gate™ single reflection diamond ATR provides a simple and effective alternative, suitable for the infrared analysis of powders. ATR analysis is less complicated than using KBr pellets, is fast and only requires a very small amount of the sample.
Spectra were collected using a Golden Gate™ Diamond ATR accessory equipped with ZnSe lenses and a single-reflection diamond ATR element. The powdered sample is simply placed onto the ATR crystal and the sample spectrum is collected. The sapphire anvil ensures that up to 100 lbs load is evenly applied to the sample lying on the diamond micro-ATR crystal during sample analysis. The sample is then cleaned from the crystal surface and the accessory is ready to collect additional spectra.
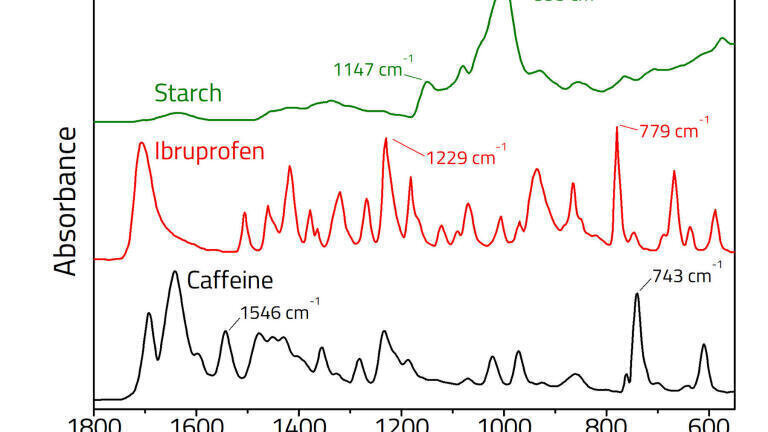
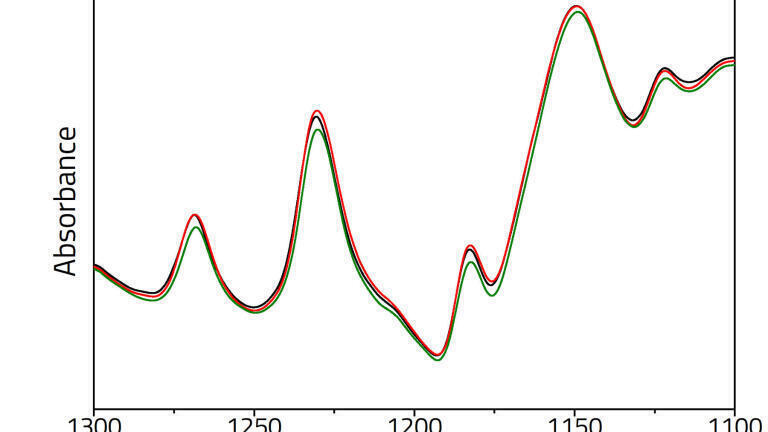
Mixtures of known concentrations of active ingredient: starch were prepared and then without additional sample preparation sample aliquots of 5-10 milligrams were placed onto the ATR element and spectra collected. For correlation with the ATR data, aliquots drawn from the standard powders were mixed with KBr powder, pressed into pellets and analysed to provide transmission spectra. FT-IR spectra were collected at 4 cm-1 resolution on a commercially available spectrometer.
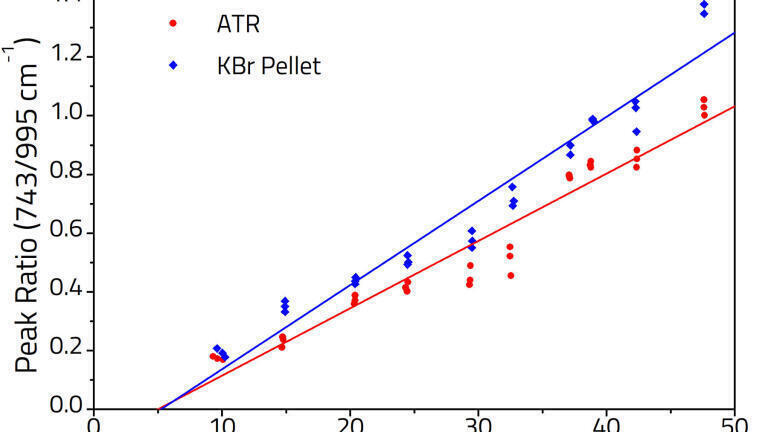
Three aliquots were prepared and analysed for each powder standard using the ATR and KBr pellet methods. Two analyte bands were selected for each component in each mixture and peak ratios calculated based on the ratio of the peak heights of the active ingredient vs. the starch. The resulting quantitative data was then fitted to a straight line using least squares regression analysis based on the Beer-Lambert Law:
A = εcl
where: A = the absorbance value of an analyte band; ε = the extinction coefficient of the analyte band; c = analyte concentration; and l = the pathlength.
A calibration model developed for KBr pellets cannot be directly applied directly to ATR spectra, as the penetration depth of ATR changes with wavelength [1], and thus the relative peak ratios at a fixed concentration will change. Hence separate calibration models must be built for KBr pellet and ATR spectra.
To view the results and Discussion on this application note, visit our website or email us to request AN15-04.
ILM 51.5 July 2026


-(1).jpg)
.jpg)

.jpg)