Mass spectrometry & spectroscopy
Published over 4 years ago. See the latest and most current information on Mass spectrometry & spectroscopy.
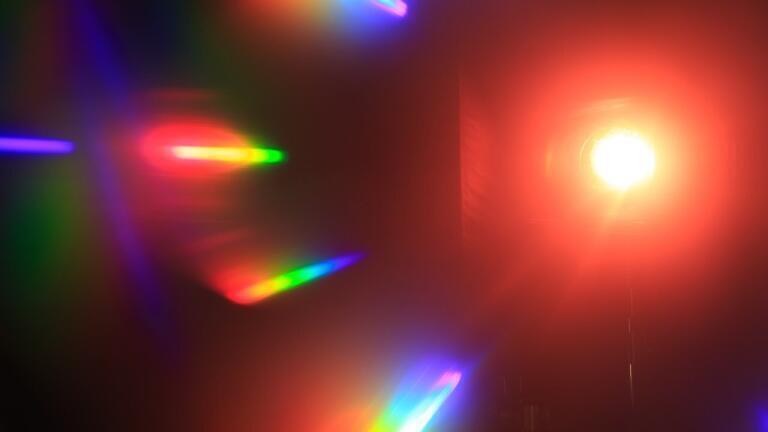
Scientific techniques are continually evolving, and spectroscopy is no exception. What started as the simple act of splitting light into different colours using a prism has grown into one of the most powerful analytical tools available to scientists. The combination of Visible Spectroscopy and Ultraviolet Spectroscopy is just one example of how a simple scientific concept can be developed into a sophisticated analytical technique.
Read on to find out how Visible Spectroscopy and Ultraviolet Spectroscopy are used together and the impact the pairing has had on modern science.
While Sir Isaac Newton is widely credited as the inventor of spectroscopy, a string of predecessors laid down the groundwork. This includes the ancient Romans, who were among the first to use a prism to split light and create a rainbow of colours. German scholar Athanasius Kircher, Bohemian scientist Jan Marek Marci, Anglo-Irish chemist Robert Boyle and Italian mathematician Francesco Maria Grimaldi also helped pave the way for Newton and the ground-breaking research he published in the 17th century.
While Visible Spectroscopy and UV Spectroscopy are both concerned with light patterns, there are some significant differences between the two. The human eye is capable of detecting visible light on a certain spectrum, generally between 380 nm (which appears as violet) and 780 nm (which appears as red). Visible Spectroscopy is concerned with wavelengths that appear on this spectrum. UV Spectroscopy takes things one step further and ventures into the UV-visible region. This makes it possible to measure ‘invisible’ wavelengths that fall within a range of 200 and 400 nm.
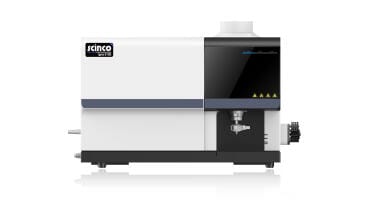
Like Visible Spectroscopy, UV Spectroscopy uses a high intensity light source to generate an absorbance spectrum. However instead of measuring transmittance patterns in the 380 nm to 780 nm range, a UV spectrometer is used to measure patterns within the UV-visible region. Data is used to detect and quantify different elements present in the sample.
From bacterial culturing and drug development to environmental testing and water quality monitoring, UV-Vis Spectroscopy is used for a wide range of applications. The technique is used for DNA and RNA analysis, with wavelengths used to detect contamination in nucleic acid samples. In the pharmaceuticals industry, UV-Vis Spectroscopy is used to measure absorbance levels in a variety of drugs, including local anaesthetics such as benzocaine and antibiotics like chlortetracycline.
UV-Vis Spectroscopy is just one of many techniques used to characterise matter. Raman Spectroscopy is one of the latest tools to push the limits of scientific analysis, with electromagnetic radiation used for everything from airport security screening to geological research. Find out more about Raman Spectroscopy, as well as other forms of spectroscopy, in ‘What Are the Different Types of Spectroscopy?’
ILM 51.5 July 2026


-(1).jpg)
.jpg)
-(1).jpg)
.jpg)