Raman spectroscopy
Published over 11 years ago. See the latest and most current information on Raman spectroscopy.
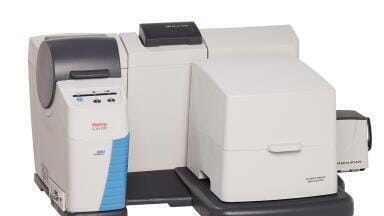
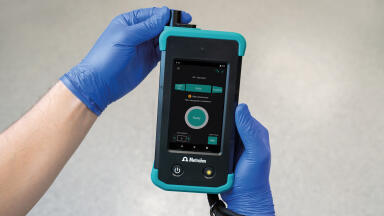
A range of options is available for Raman analysis, including systems suitable for handheld, laboratory and educational applications. Fully integrated systems typically include a spectrometer, laser, operating software and sampling accessories, while modular options are available for users to configure their own Raman systems. Setups are available for various wavelength ranges and resolution requirements.
Introduction
Raman spectroscopy offers a number of benefits for testing and characterisation. It is rapid and non-destructive, requires only limited sample preparation and allows for sample volumes in the microliter range. In addition, Raman can be used to measure aqueous samples or samples with high moisture content, and allows researchers to capture data from a sample contained in plastic or other materials that are optically transparent to the wavelengths of interest.
Raman is particularly useful for pharmaceutical applications. For example, Raman techniques are used to discern characteristics of pharmaceutical raw materials, including active ingredients, binders, fillers, lubricants and other excipients. Raman is also useful for through-container measurements of pharmaceutical blister packs, pill bottles and vials.
Experimental Conditions
To illustrate the capabilities of our Raman systems we analysed paracetamol (acetaminophen) and carbamazepine, which are pharmaceutical active ingredients, and the excipients alpha and beta lactose. The samples studied consisted of simple organic compounds contained in standard, clear borosilicate scintillation vials. No additional preparation was necessary.
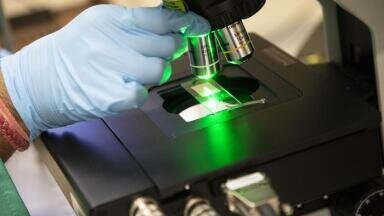
Samples were analysed using a modular Raman setup comprising an Ocean Optics QE series spectrometer, a 785 nm laser with 500 mW output and a fiber optic probe. The spectrometer was set from ~780-940 nm and configured with a 50 µm slit for good optical resolution. High reflectivity optical bench mirrors were added to increase spectrometer sensitivity.
To collect the Raman signal, we placed the tip of the probe at the bottom of three glass vials containing the samples. We measured the samples at an integration time of 8 seconds and averaged three spectra.
Results
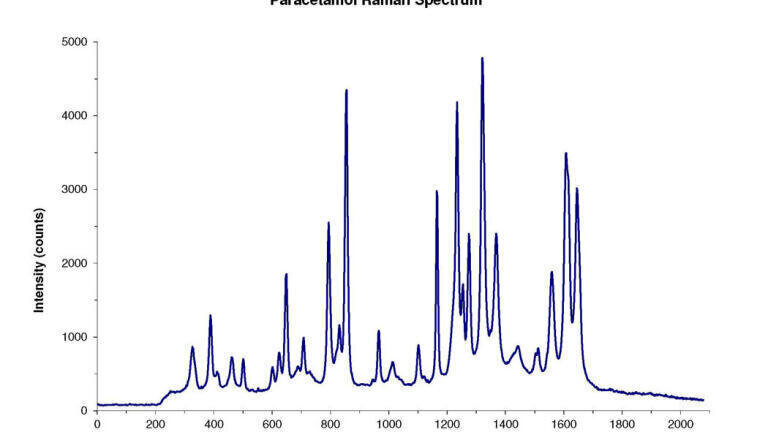
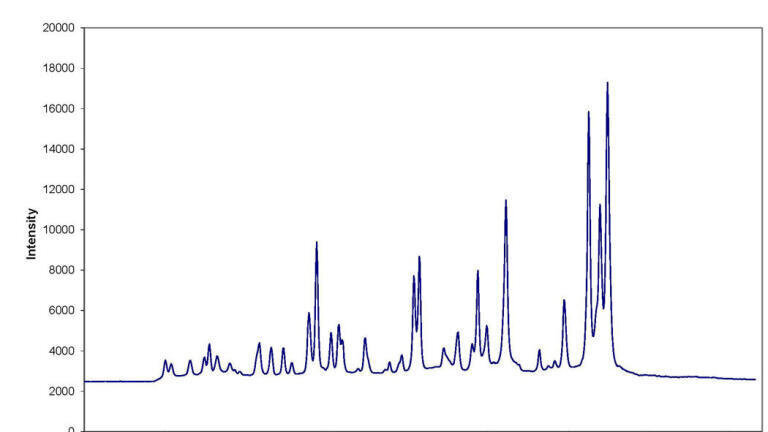
Our measurements confirmed that this particular Raman configuration can differentiate pharmaceutical active materials such as paracetamol (Figure 1) and carbamazepine (Figure 2) based on their spectral fingerprints. Also, the experiment helped demonstrate that, with proper method development and application of chemometric analysis, Ocean Optics Raman setups can be used to obtain semi-quantitative data of active ingredients in a pharmaceutical mixture.
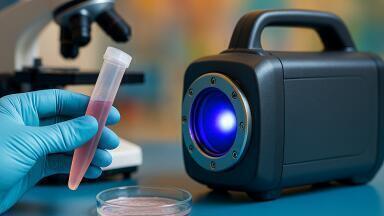
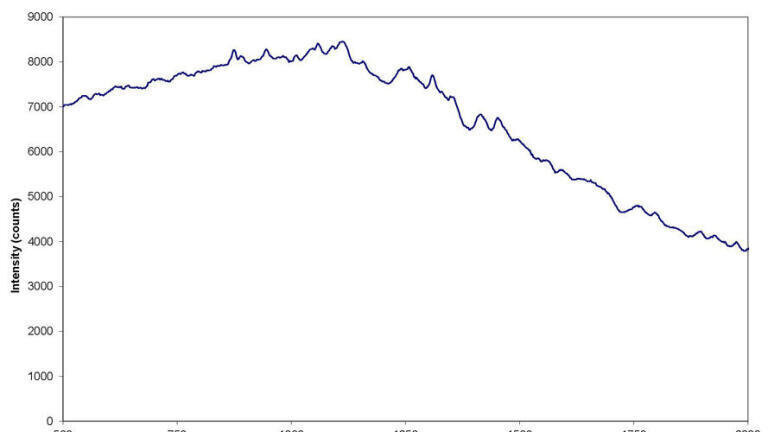
In addition, our experiment showed that Raman response and fluorescence occurs in the lactose samples (Figure 3). Fluorescence is a common phenomenon in Raman measurements of some organic compounds and depends on the wavelength of the laser utilised.
Conclusions
The availability of both turnkey and modular Raman systems, complemented by sophisticated chemometric analysis packages and spectral libraries, makes Raman spectroscopy a versatile choice for a host of applications.
Lab Asia 33.4 - August 2026


-(1).jpg)