Following a number of reports about prosthetic limbs, a newly published study looks at how
science software can help people during rehabilitation or old age to use their own muscles more effectively.
The Economic & Social Research Council, a UK-based research-funding organisation, reports on the creation of
science software at the Glasgow School of Art's School of Design.
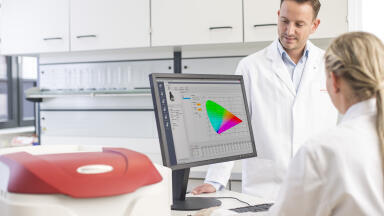
Participants are fitted with sensors to record biomechanics data while they carry out simple tasks of the sort performed every day.
The information fed back to the software is charted to determine any major stress points that might otherwise go unnoticed.
Simple traffic light signals help to identify maximum stress as red, zero stress as green and muscle demand in the middle of the range as amber.
By presenting the data in this visual way, the program aims to ensure that viewers with no specialist training are still able to interpret its results.


.jpg)


-(1).jpg)